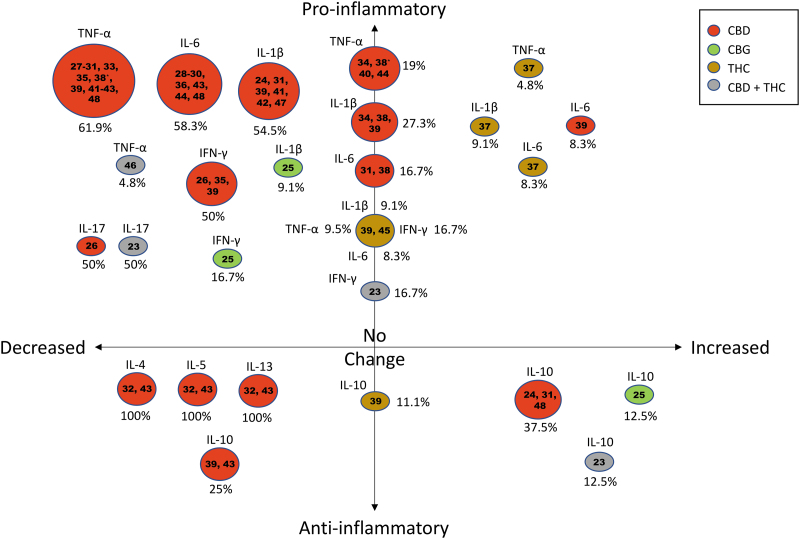
FIG. 3.
Change in inflammatory cytokine levels from included studies are summarized in the bubble plot together with the cannabinoids assessed. The bubble plot is depicted in four quadrants: decreasing levels of pro-inflammatory cytokines (top left), increasing levels of pro-inflammatory cytokines (top right), decreasing levels of anti-inflammatory cytokines (bottom left), and increasing levels of anti-inflammatory cytokines (bottom right). Percentages were calculated based on the number of studies showing the observed change in the specific cytokine levels for a particular cannabinoid, divided by the total number of studies for that specific cytokine (some studies may be calculated twice to reflect treatment with different cannabinoids used in a single study). *Differing results for the effects of CBD on TNF-α within a single study. CBD, cannabidiol; CBG, cannabigerol; IL, interleukin; THC, delta 9-tetrahydrocannabinol; TNF-α, tumor necrosis factor alpha.

