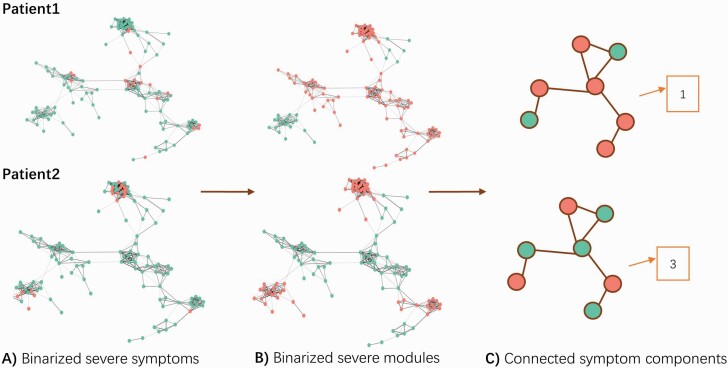
Fig. 1.
Measuring the degree of clustering intrinsic to individual symptom profiles. The degree of symptom clustering was measured by (A) delineating severe symptoms (red circles) and non-severe symptoms (green circles). (B) Modules containing a severe symptom were designated as “active symptom modules” (red modules) and modules without severe symptoms were designated as “non-active symptom modules” (green modules). (C) The degree of symptom clustering was obtained by computing the number of connected components among the active symptom modules. Patient 1 displays high symptom clustering as all active modules are connected (forming a total of one connected component), whereas Patient 2 displays weaker symptom clustering, as their active symptom modules formed 3 connected components (ie, their symptoms are more disconnected/segregated compared to Patient 1).

