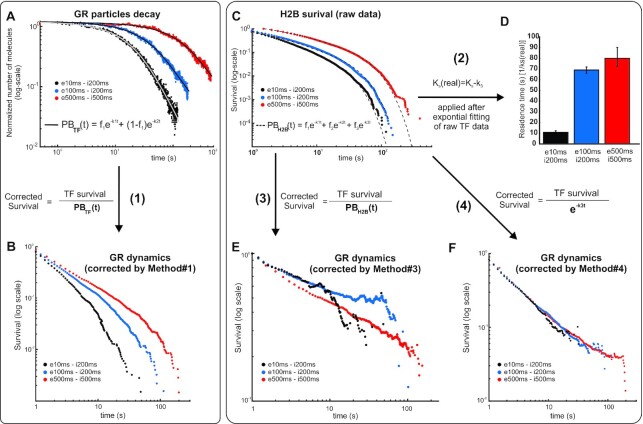
Figure 2.
Effect of different photobleaching (PB) correction methods on the survival distribution of GR. (A) The number of particles (normalized to the initial number of particles for each cell at time zero) from frame-to-frame as a function of time shown for three different acquisition conditions as indicated in the legend (‘e’ denotes exposure time and ‘i' denotes inter-frame interval). In method #1, this is taken as a proxy for PB, which is fitted to a bi-exponential function (black lines). (B) Effect of method #1 on GR dynamics at different acquisition conditions (e, exposure time; i, interval time). The corrected survival is obtained by dividing the observed TF survival to the bi-exponential distribution obtained in A. Number of cells/number of tracks are 67/9374 for GRe10ms/i200ms; 65/23172 for GRe100ms/i200ms; and 34/37953 for GRe500ms/i500ms. (C) In methods #2–4, the survival of H2B, taken under the same acquisition conditions as the TF, is used as a proxy for PB, which is fitted to either two or three family of exponentials. Number of cells/number of tracks are 100/36625 for H2Be10ms/i200ms; 63/40652 for H2Be100ms/i200ms; and 36/20307 for H2Be500ms/i500ms. (D) Method #2 does not correct the entire TF survival distribution but rather uses the slowest rate of the histone survival fitting (k3) to correct by subtraction the rate of the TF fitting (ks), thus obtaining the ‘real’ rate (ks(real)). The panel shows the residence time (1/ ks) for the three experimental acquisition conditions. (E) Method #3 is similar to method #1, except that it uses H2B survival as a proxy for PB correction. The panel show GR dynamics at different acquisition conditions. (F) In Method #4, the exponential distribution of the slowest component in H2B survival is used as a proxy for PB correction. The panel show GR dynamics at different acquisition conditions. See Supplementary Table S1 for more data points details.

