Figure 3.
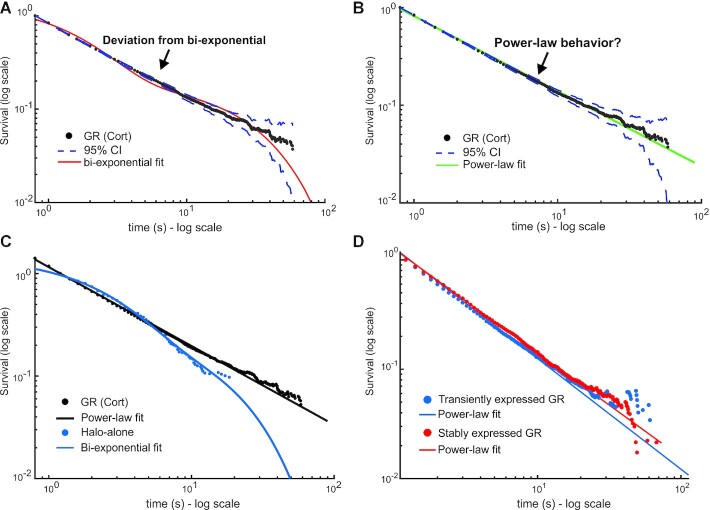
Impact of PB correction on GR dynamics. (A, B) Single-molecule tracking data of GR activated with corticosterone (Cort). Data was acquired at 100 ms exposure time with 200ms interval. The survival distribution is shown (black), fit to a bi-exponential (A) or a power-law (B) function. Dashed lines show 95% confidence intervals (CI). Number of cells = 65; number of tracks = 23172. (C) Comparison of survival distributions of HaloTag-alone (blue) with a bi-exponential fit and HaloTag-GR (black) with a power-law fit. Data was acquired at 100 ms exposure time with 200ms interval. Number of cells = 64; number of tracks = 19436. (D) Survival distributions of HaloTag-GR, treated with Dex, either transiently transfected in 3617 cells (blue) or stably integrated in a GR knock-out subclone (red), expressed at endogenous levels. Data was acquired at 10ms exposure time with 200ms interval. Number of cells = 60; number of tracks = 7068 for GR transient. Number of cells = 60; number of tracks = 16450 for GR stable. Colored lines show power-law fits. See Supplementary Table S1 for details on fits.

