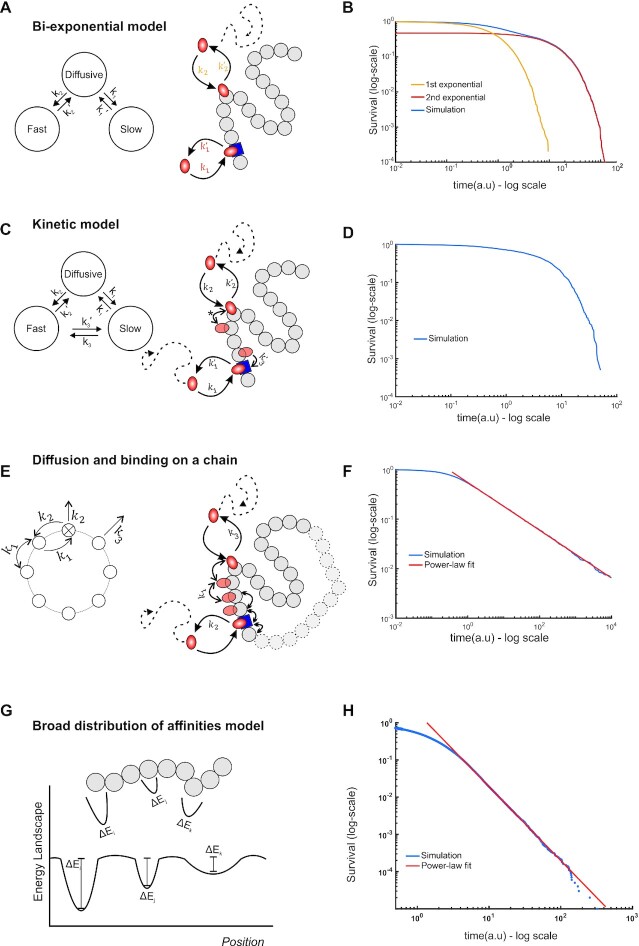
Figure 4.
Theoretical models for TF kinetics. (A) State diagram (left) and schematic (right) of the bi-exponential model. TFs (orange oval) can bind to specific sites (blue square) or non-specific sites (grey circles) with rate constants k1 and k2 or unbind and return to the diffusive state with rate constants, k’1 and k’2 respectively (A). Transitions between specific and non-specific sites are forbidden. (B) Numerical simulation showing the emergence of bi-exponential behavior for the model in A. The first and second exponential components are also shown as indicated. (C) State diagram (left) and schematic (right) of the Kinetic model. In addition to binding/unbinding to/from specific and non-specific sites, TFs can transition from specific sites to non-specific sites (with rate constant k3) and vice versa (with rate constant k’3). Transitions between non-specific sites are considered indistinguishable (denoted by *). (D) Simulation results showing survival distributions arising from the kinetic model. (E) State diagram (left) of the continuum of affinities model, showing that transitions from a non-specific site to any other site occur with rate constant k1 and from a specific to a non-specific site with rate constant k2. Transitions to the diffusive state from the specific site occur with rate constant k2 and from a non-specific site with rate constant k3. Schematic (right) illustrating that a TF arrives at a random site and scans the DNA until it finds a specific site from which it can subsequently unbind. (F) Simulation of (E) to calculate the dwell time, which is defined as the time spent on the DNA, either bound or sliding, showing the emergence of power-law behavior (red line, PL exponent 0.5, k1= 10 a.u., k2= 1 a.u., k3= 10 a.u.). (G) Schematic of the energy landscapes, representing the different binding affinities and the local microenvironment denoted as potential wells with different depths. (H) Numerical simulation of (G) showing the emergence of power-law behavior (blue line). See also Supplementary Note 1 for details.

