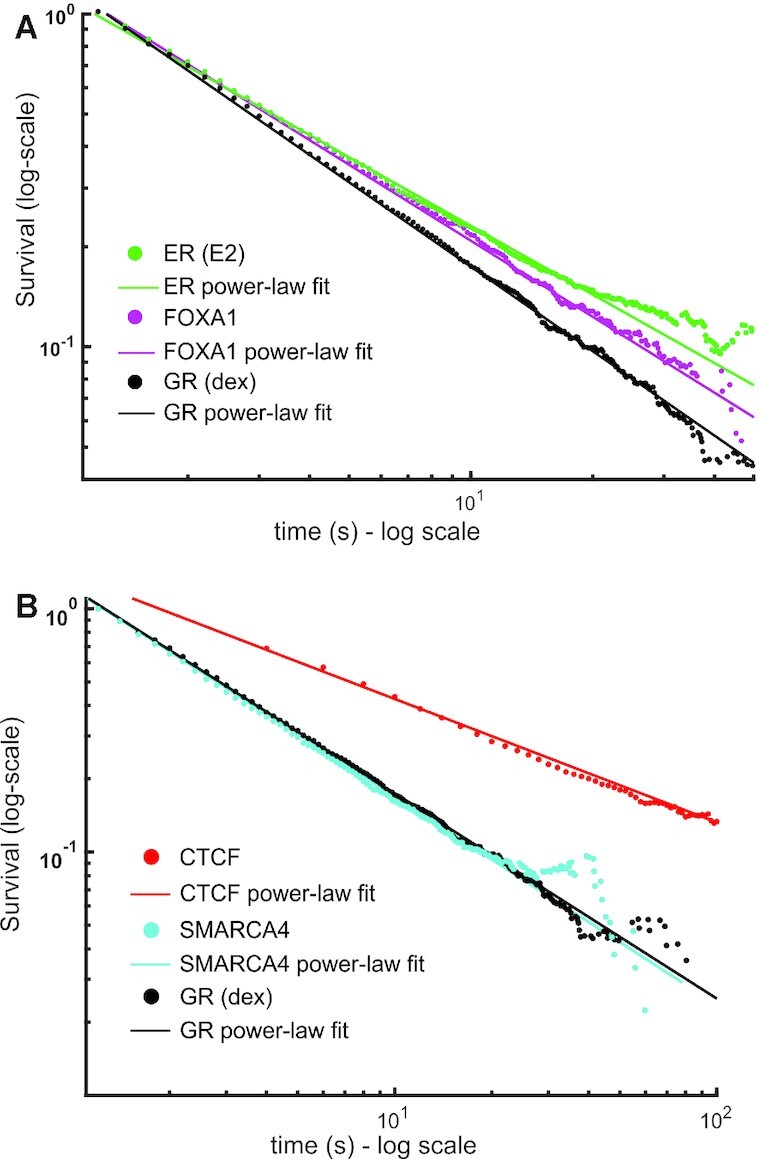
Figure 6.

Dwell time distributions of TFs and other chromatin associated proteins show power-law behavior. (A, B) Survival distribution calculated from SMT data of the Halo-Tagged oestrogen receptor (ER, activated with oestradiol, E2) (green), FOXA1 (magenta), CTCF (red) and SMARCA4 (cyan). GR (activated with dex, black) is shown for comparison in both plots. Data was acquired at 10 ms exposure time with 200ms interval. Number of cells/number of tracks are 60/17 823 for ER; 41/12 864 for FOXA1; 50/7023 for SMARCA4, 40/29 211 for GR (dex). CTCF data was acquired with a 10 ms exposure time and a 2000 ms interval. Number of cells/number of tracks are 48/11606 for CTCF. Symbols are SMT data and solid lines are power-law fits to the data (see Supplementary Table S1 for comparison and number of data points).
