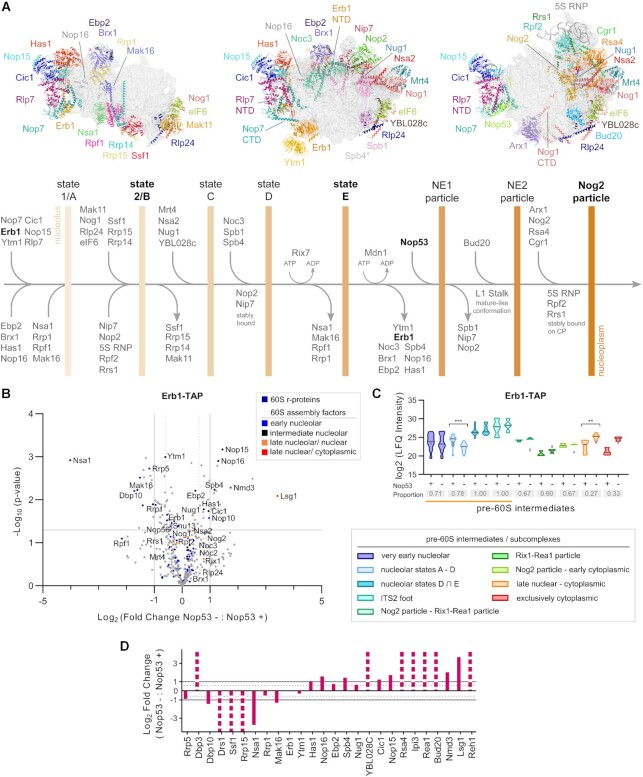
Figure 3.
Erb1 is mostly associated with state E and late pre-60S particles upon depletion of Nop53. (A) Schematic representation of early nucleolar and nuclear 60S maturation steps showing the sequential changes in protein composition that leads to the pre-60S intermediates, indicated by vertical bars. Structures correspond to PDB IDs: 6C0F, 6ELZand 3JCT. *Spb4 is present in state E but not shown. NE: Nop53 early particle, NTD: N-terminal domain, CTD: C-terminal domain. (B–D) Mass spectrometry-based label-free quantitative proteomic analysis of preribosomes affinity-purified in biological triplicates with Erb1-TAP. (B) Comparison between Nop53 depleted (−) and non-depleted (+) conditions highlighting the identified 60S r-proteins and AFs. The latter were classified according to the 60S maturation stage they participate in. (C) Analysis of clusters of 60S AFs representative of specific pre-60S intermediates. Violin plots show the distribution of the copurified 60S AFs based on their log2-transformed LFQ Intensity values (states D ∩ E designates intersection—common AFs between these particles); height: delimited by the highest and lowest LFQ Intensity values of the cluster; width: frequency (high: wide; low: narrow) of the LFQ Intensity values observed in the cluster. The 60S AFs identified in only one condition (Nop53+ or Nop53–) are depicted as gray triangles. The median is indicated by a dark gray line. Increased (higher median) or decreased (lower median) association with components of the indicated pre-60S intermediates is revealed by comparing Nop53 depleted (−) and non-depleted (+) conditions. Statistically significant (P < 0.05) differences are highlighted in the graph (***P = 0.0001; **P = 0.0043). Gray boxes show the proportion of each cluster that was affinity-purified (number of affinity-purified 60S AFs components of the cluster/ total number of 60S AFs in the cluster). A horizontal bar indicates the pre-60S intermediates with which Erb1 is expected to be associated. (D) The log2-transformed fold change value of each identified 60S AF was normalized to the bait and orderly plotted according to their sequential engagement in the 60S assembly. Dashed columns indicate the 60S AFs exclusively identified in one condition.

