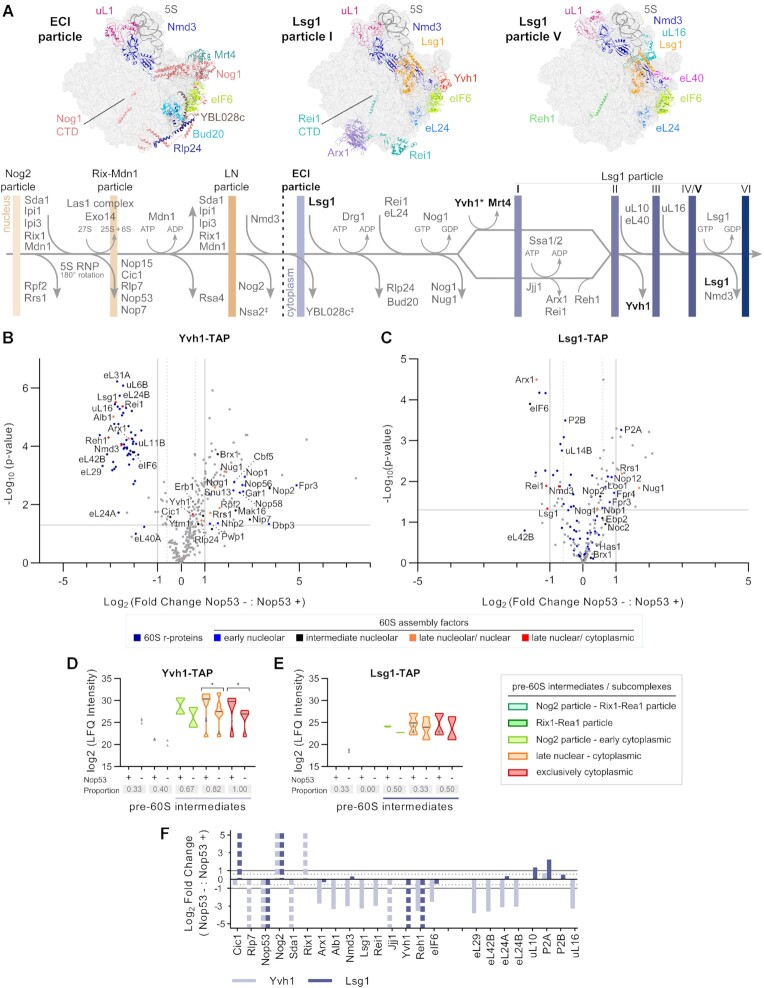
Figure 4.
Nop53 depletion has different impacts on the interactome of the late-binding 60S AFs Yvh1 and Lsg1. (A) Schematic representation of late nuclear and cytoplasmic 60S maturation events highlighting the protein compositional changes and the resulting pre-60S intermediates, indicated by vertical bars (Structures correspond to PDB IDs: 6N8K, 6RZZ and 6RI5). LN: late nuclear Rlp24 particle; ECI: early cytoplasmic-immediate Rlp24 particle; CTD: C-terminal domain; ‡ uncertain dissociation stage; * late nuclear/cytoplasmic recruitment. (B–F) Effect of Nop53 depletion on late 60S maturation stages. Preribosomes affinity-purified in biological triplicates with the late-binding AFs (B) Yvh1 and (C) Lsg1 were analyzed by mass spectrometry-based label-free quantitative proteomics. Volcano plots show the comparison between Nop53 depleted (−) and non-depleted (+) conditions. The identified 60S r-proteins and AFs are highlighted in colors according to the 60S maturation stages they participate in. (D, E) Analysis of clusters of 60S AFs representative of specific pre-60S intermediates. Violin plots show the distribution of the copurified 60S AFs based on their log2-transformed LFQ Intensity values; height: delimited by the highest and lowest LFQ Intensity values of the cluster; width: frequency (high: wide; low: narrow) of the LFQ Intensity values observed in the cluster. The 60S AFs identified in only one condition (Nop53+ or Nop53-) are depicted as gray triangles. The median is indicated by a dark gray line. Increased (higher median) or decreased (lower median) association with components of the indicated pre-60S intermediates is revealed by comparing Nop53 depleted (−) and non-depleted (+) conditions. Statistically significant (P < 0.05) differences are highlighted in the graph (Yvh1-TAP * P = 0.03150; * P = 0.00205). Gray boxes show the proportion of each cluster that was affinity-purified (number of affinity-purified 60S AFs components of the cluster/ total number of 60S AFs in the cluster). A horizontal bar indicates the pre-60S intermediates with which Yvh1 or Lsg1 are expected to be associated. (F) log2-transformed fold change values of intermediate/late 60S AFs and cytoplasmic 60S r-proteins, normalized to the bait, were plotted following their order of association with the pre-60S. Dashed columns indicate the 60S AFs exclusively identified in one condition.

