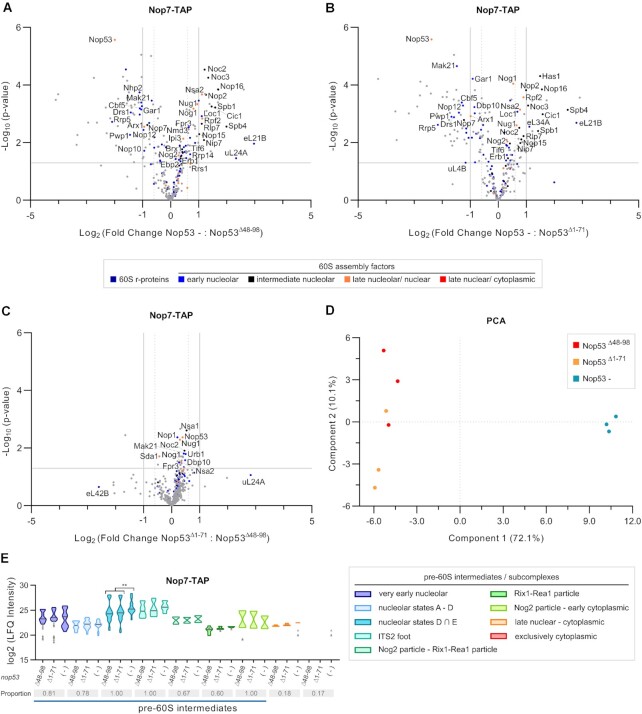
Figure 8.
Impact of nop53 N-terminal truncated mutants on the 60S subunit assembly compared to depletion of Nop53. Nop7-TAP was expressed in the conditional strain Δnop53/ptet-Off-GFP-NOP53 carrying the empty vector, or expressing one of the mutants GFP-nop53Δ48–98 and GFP-nop53Δ1–71. Strains were grown at the same conditions, under repression of NOP53 full-length expression. Preribosomes copurified with Nop7-TAP in biological triplicates upon depletion of Nop53 or in the presence of nop53 N-terminal mutants were analyzed by mass spectrometry-based label-free quantitative proteomics. Volcano plots show the comparison of Nop53 depletion (Nop53-) with (A) nop53Δ48–98 and with (B) nop53Δ1–71, as well as between the (C) nop53 mutants (nop53Δ1–71 versus nop53Δ48–98). 60S r-proteins and AFs are highlighted in colors, the latter being classified according to the 60S maturation stage they participate in. (D) PCA plot (Benjamini-Hochberg cut-off FDR 0.05) compares the proteomic profiles of the biological replicates. (E) Analysis of clusters of 60S AFs representative of specific pre-60S intermediates. Violin plots show the distribution of the copurified 60S AFs based on their log2-transformed LFQ Intensity values (states D ∩ E designates intersection – common AFs between these particles); height: delimited by the highest and lowest LFQ Intensity values of the cluster; width: frequency (high: wide; low: narrow) of the LFQ Intensity values observed in the cluster. The 60S AFs identified in only one or two conditions are depicted as gray triangles. The median is indicated by a dark gray line. The three conditions were pairwise compared and statistically significant (P < 0.05) differences are highlighted in the graph (Nop53 – versus nop53Δ48–98 ** P = 0.0015; Nop53 – versus nop53Δ1–71 **P = 0.0065). Gray boxes show the proportion of each cluster that was affinity-purified (number of affinity-purified 60S AFs components of the cluster/ total number of 60S AFs in the cluster). A horizontal bar indicates the pre-60S intermediates with which Nop7 is expected to be associated.

