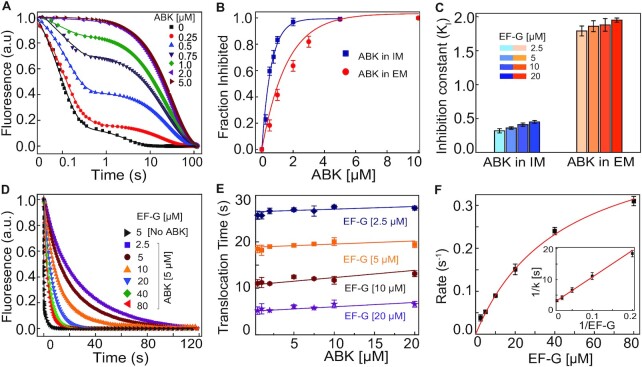
Figure 3.
Effects of ABK on EF-G catalyzed mRNA translocation. (A) Real time fluorescence traces for the EF-G (5 μM) induced translocation of pyrene-labeled mRNA on 70S ribosome (0.5 μM). Ribosomes were pre-incubated with various ABK concentrations as indicated. The amplitudes and rates of fast and slow phases of fluorescence decrease were obtained from double exponential fit (solid lines) of experimental traces. The mean times of the fast and slow phases mRNA movement were estimated from the reciprocal of the rates. (B) The fraction of ABK inhibited ribosomes when ABK was added in the ‘initiation mix’ (IM, blue), and when it was added in the ‘elongation mix’ (EM, red). Solid lines represent hyperbolic fit of the data. (C) Inhibition constants (KI) for the ABK inhibition of translocation with various amounts of EF-G. (D) Time traces for pyrene-labeled mRNA translocation on the ABK (5 μM) saturated ribosomes with increasing concentrations of EF-G (2.5–80 μM). (E) Translocation times of pyrene-labeled mRNA on the ABK-stalled ribosomes at various ABK (0.5–20 μM) and EF-G (2.5–20 μM) concentrations, estimated from multiple experiments as in A. (F) Increase in the rates of mRNA translocation on the ABK-stalled ribosomes with increasing EF-G concentrations. The solid line is hyperbolic fit of the data. Inset shows the double reciprocal plot of the data for estimation of kcat and KM parameters. Error bars indicate the SEM of data obtained from at least three independent experiments.

