Figure 2.
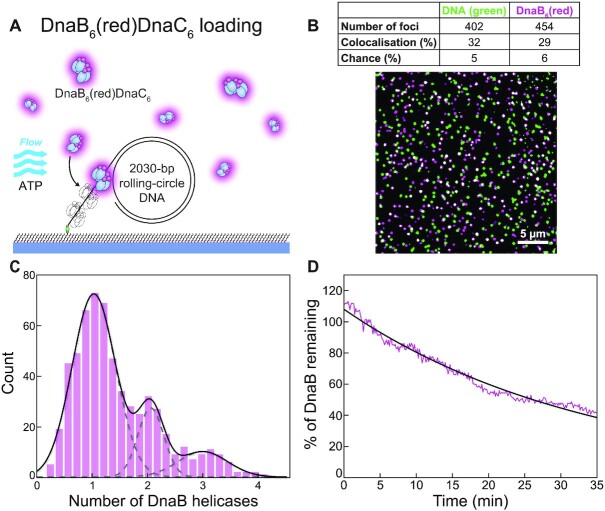
Visualisation of loaded DnaB helicases at the single-molecule level. (A) Illustration of the singlemolecule helicase-loading assay. DnaB6(red)DnaC6, a 2030 bp rolling-circle DNA template and the nucleotides required for loading are mixed and applied to a microfluidic flow channel. The 5′-biotinylated DNA couples to the streptavidin-functionalised surface and immobilises the complex. (B) Loaded DnaB helicases appear as colocalised foci (white) of DnaB6(red) and SYTOX Orange-stained DNA (green). The table indicates the number of foci, the degree of colocalisation and the degree of coincidental colocalisation by chance. (C) Distribution of DnaB6(red) stoichiometry loaded onto the 59-nt single-stranded DNA tail (n = 606). The black line represents the sum of three Gaussian distribution functions fit to the data. The dashed grey lines represent the individual Gaussian distributions. (D) The average binding lifetime of loaded DnaB6(red) molecules (magenta; n = 123). A single-exponential fit to the data (black) gives a binding lifetime of 34.4 ± 0.4 min. Photobleaching time is measured to be ∼60 min (Supplementary Figure S4) and therefore does not significantly impact on the observed kinetics.

