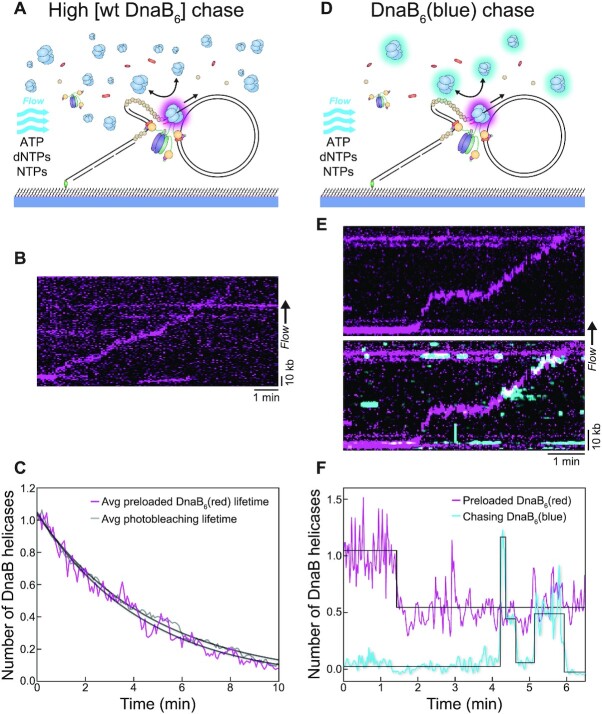
Figure 4.
DnaB helicases are both stable and dynamic during replication. (A) Illustration of the WT DnaB chase assay, where preloaded DnaB6(red) was ‘chased’ with a relatively high concentration of WT DnaB (30 nM) in the replication solution. Like the standard rolling-circle assay, DNA products are stretched out by hydrodynamic force. (B) Representative kymograph of DnaB6(red) moving with the fork during rolling-circle replication in the WT DnaB chase assay. (C) The average intensity over time from replicating DnaB6(red) molecules in the WT DnaB chase assay (magenta; n = 29), compared to the photobleaching lifetime of DnaB6(red) (grey; n = 667). The curve from each condition is fit with a single-exponential decay to provide the characteristic lifetime. (D) Illustration of the DnaB6(blue) chase assay, where preloaded DnaB6(red) is ‘chased’ with DnaB6(blue) (2 nM) in the replication solution. Again, the DNA products are stretched out by hydrodynamic force. (E) (Top) Representative kymographs of DnaB6(red) moving with the fork during rolling-circle replication in the DnaB6(blue) chase assay. (Bottom) The DnaB6(blue) kymograph from the same replication event shows the frequent association of additional helicases with the replication fork. (F) The stoichiometry over time from both the DnaB6(red) and DnaB6(blue) signal corresponding to the kymograph in (E), where steps are detected by change-point analysis (47–49).

