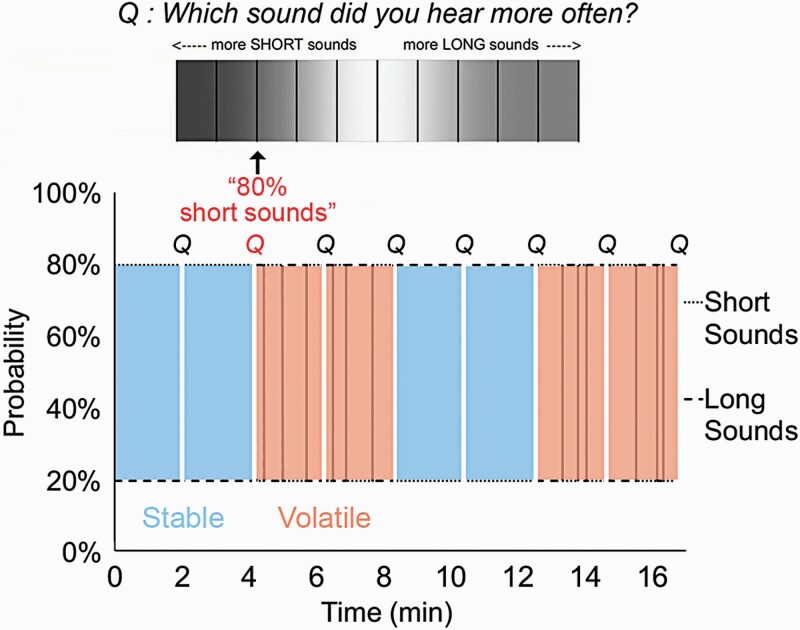
Fig. 1.
Reversal oddball task. A schematic diagram showing 4 stable and 4 volatile blocks (16.67 min total duration), each separated by a break and questions (approximately 3 min duration). The total duration of the experiment was approximately 20 min. The order of the blocks was counterbalanced between participants. In the first stable block depicted here, the short sound (50 ms) was more probable (80%) throughout, whereas in the first volatile block, the long sound (100 ms) was more probable at first, and then the short sound was more probable, with 3 reversals (vertical lines) of probability in total in each volatile block. Participants were asked to listen to the sounds and estimate the probability (top Q) of the most frequent sound and also rate their confidence on this judgment, every 2:08 min. The colored Q in shows an example of a correct response for the second stable block.

