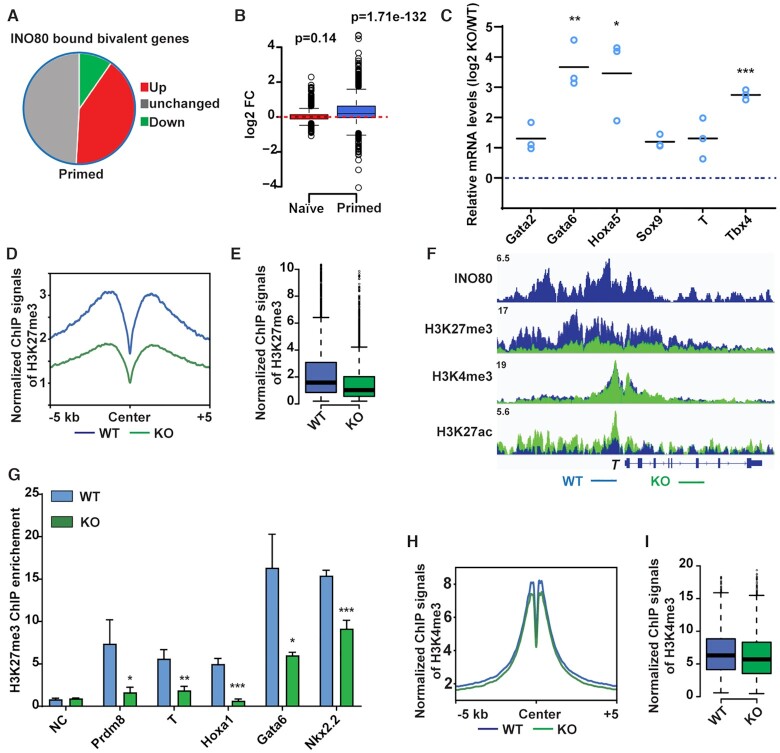
Figure 3.
INO80 is required for H3K27me3 occupancy at the bivalent promoters. (A) Gene expression changes in INO80-bound bivalent genes in the primed state. (B) Box plot to show changes in the expression of INO80-bound bivalent genes. Gene expression changes were determined by RNA-seq and plotted in log2 fold-change of (RPKM+1). p-value was calculated by the Wilcoxon signed rank test. (C) Expression of selected INO80-bound bivalent genes during EB differentiation. ESCs were cultured in FA and treated with DMSO or 4-OHT to induce Ino80 deletion for two days, and then aggregated to form EBs for 2 days to initiate differentiation. Relative mRNA levels in wild-type and Ino80 KO EBs were determined by RT-qPCR, normalized by Gapdh, normalized to wild-type ESCs, and log2 transformed. Scattered dots represent three independent experiments. p-values were calculated by student t-test: * <0.05, ** <0.01, *** <0.001. (D, E) H3K27me3 occupancy at INO80-bound bivalent TSSs in WT and Ino80 deletion cells in the primed state. ESCs were cultured in FAX and treated with DMSO or 4-OHT to induce Ino80 deletion for two days. H3K27me3 occupancy was determined by ChIP-seq, and normalized ChIP-seq signal was used for metagene (D) and box (E) plots. (F) Genome browser view of INO80, H3K27me3, H3K4me3, and H3K27ac occupancy near T in WT and Ino80 deletion cells in the primed state. (G) H3K27me3 occupancy at representative bivalent gene promoters as determined by ChIP-qPCR. Fold-enrichment was plotted as mean ± SEM from three replicates. p-values were calculated by student t-test: * <0.05, ** <0.01, *** <0.001. (H, I) H3K4me3 occupancy at INO80-bound bivalent TSSs in WT and Ino80 deletion cells in the primed state. Normalized ChIP-seq signal was used for metagene (H) and box (I) plots.

