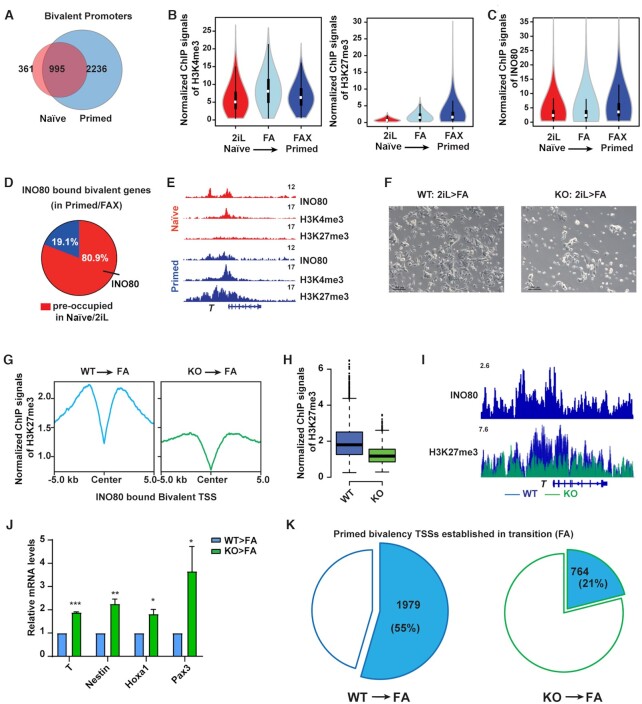
Figure 4.
INO80 is required for the establishment of bivalency. (A) Venn diagram to show the overlap of bivalent promoters between the naïve and primed state. (B) Violin plots to show normalized H3K4me3 and H3K27me3 ChIP-seq signal intensity at bivalent promoters during the naïve to primed transition. (C) Violin plot to show normalized INO80 ChIP-seq signal intensity at bivalent promoters during the naïve to primed transition. (D) Pie chart to show INO80 occupancy in the naïve state at the primed bivalent promoters. (E) Genome browser view of INO80, H3K4me3, H3K27me3 occupancy at T in the naïve and primed state. (F–K)Ino80 deletion during the naïve to primed transition. ESCs were cultured in 2iL and treated with 4-OHT to induce Ino80 deletion for two days. Cells were then transferred to the FA medium for another 2 days, imaged (F), and collected for ChIP-seq and RT-qPCR (G–K). Normalized H3K27me3 ChIP-seq signal at INO80-bound primed bivalent gene promoters was examined by metagene (G) and box (H) plots. INO80 and H3K27me3 occupancy near T was shown by the genome browser view (I). The relative expression of selected primed bivalent genes in wild-type and Ino80 deletion cells was determined by RT-qPCR, first normalized to Gapdh and then normalized to wild-type cells, and plotted as mean ± SEM from three independent experiments. p-values were calculated by Student's t-test: * <0.05, ** <0.01, *** <0.001 (J). The numbers of successfully established bivalent promoters during the naïve to primed transition in WT or Ino80 deletion cells were shown by the pie chart (K).

