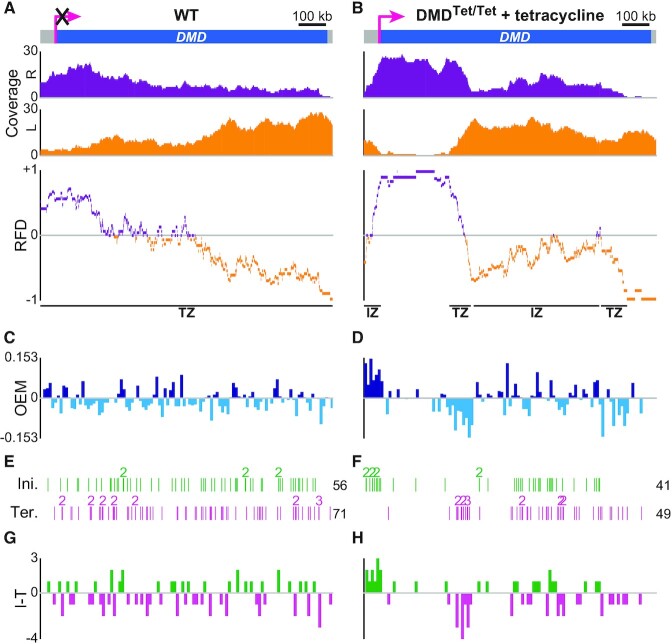
Figure 2.
DNA combing-based RFD profiling of transcriptionally inactive and active DMD in DT40 cells. (A, B) RFD profile of DMD in WT cells (A) and DMDTet/Tet cells with tetracycline (B). From top to bottom: DMD locus (pink arrow, active promoter; the superimposed black cross indicates that WT DMD is not transcribed); coverages of rightward- (R, purple) and leftward-replicated DNA (L, orange); RFD profile, with manually annotated IZs and TZs delimited by black lines to guide the eyes. Data were computed from Supplementary Figure 4A in (46). 279 (mean size 85.9 kb) and 240 (mean size 103.8 kb) oriented tracks were aggregated to compute the RFD profile of DMD in WT cells and DMDTet/Tet cells with tetracycline, respectively. (C, D) OEM computed in 10 kb windows from the RFD profile of DMD in WT cells (C) and DMDTet/Tet cells with tetracycline (D). (E, F) Map of initiation (Ini.) and termination (Ter.) events along DMD in WT cells (E) and DMDTet/Tet cells with tetracycline (F) (data from Figure 1C, D in (46)). Each vertical line corresponds to the position of one initiation or termination event; numbers indicate colocalized events; the total number of events is indicated on the right. Because RFD profiles were strictly computed within the limits of the probes used to identify combed DNA molecules spanning DMD, the very limited number of events situated outside of those boundaries are not represented, which explains why the total number of initiation and termination events is sometimes slightly lower than in (46). (G, H) Density profile of initiation minus termination events (I − T) in 10 kb windows of DMD in WT cells (G) and DMDTet/Tet cells with tetracycline (H).

