Figure 3.
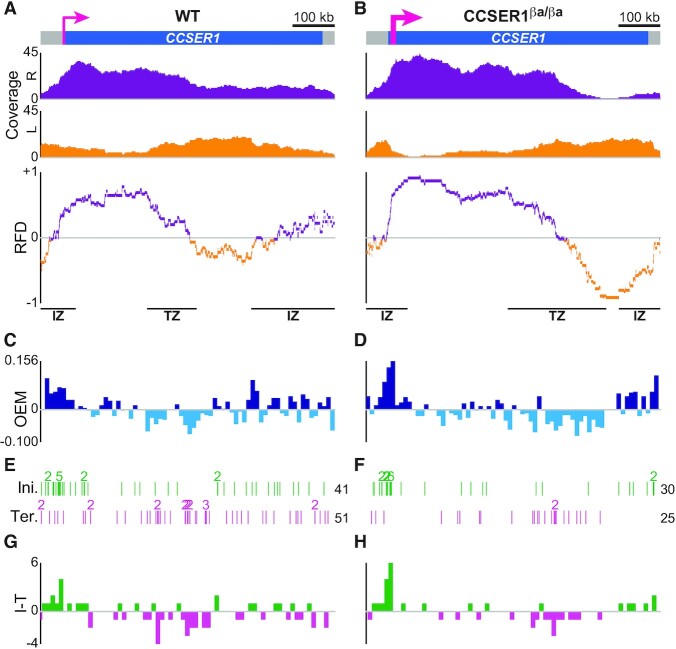
DNA combing-based RFD profiling of WT and overexpressed CCSER1 in DT40 cells. (A, B) RFD profile of CCSER1 in WT (A) and CCSER1βa/βa cells (B). From top to bottom: CCSER1 locus (thin and thick pink arrows, active CCSER1 promoter in WT cells and active β-actin promoter in CCSER1βa/βa cells, respectively); coverages of rightward- (R, purple) and leftward-replicated DNA (L, orange); RFD profile, with manually annotated IZs and TZs delimited by black lines to guide the eyes. Data were computed from Supplementary Figure 4B in (46). 211 (mean size 97.4 kb) and 240 (mean size 88.6 kb) oriented tracks were aggregated to compute the RFD profile of CCSER1 in WT and CCSER1βa/βa cells, respectively. (C, D) OEM computed in 10 kb windows from the RFD profile of CCSER1 in WT (C) and CCSER1βa/βa cells (D). (E, F) Map of initiation (Ini.) and termination (Ter.) events along CCSER1 in WT (E) and CCSER1βa/βa cells (F) (data from Figure 2C, D in (46)). See Figure 2E for details. (G, H) Density profile of initiation minus termination events (I − T) in 10 kb windows of CCSER1 in WT (G) and CCSER1βa/βa cells (H).

