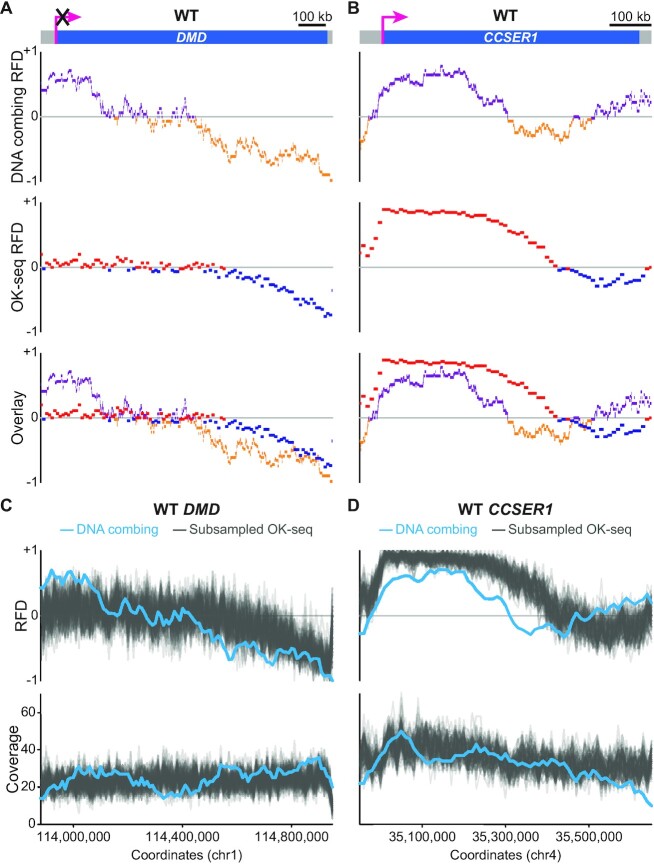
Figure 4.
Comparison of DNA combing- and OK-seq-based RFD profiles of WT DMD and CCSER1. (A, B) Comparative analysis of the RFD profiles of WT DMD (A) and CCSER1 (B) obtained by both methods. From top to bottom: locus represented as in Figures 2 or 3; RFD profile from DNA combing data; RFD profile from OK-seq data binned into 10 kb adjacent windows; overlay of the two profiles. The OK-seq experiment was performed three times with similar results; one representative profile is presented for the DMD and CCSER1 loci. (C, D) Assessment of the sampling effect for WT DMD and CCSER1 DNA combing-based RFD computation. One hundred RFD profiles were computed from OK-seq reads randomly subsampled to obtain a coverage comparable to that of WT DMD (C) or CCSER1 (D) DNA combing analysis (see Material and Methods for details). From top to bottom: RFD profile from DNA combing data (light blue line) and 100 subsampled RFD profiles from OK-seq data (gray lines) binned into adjacent 10 kb windows; coverages of the DNA combing- and subsampled OK-seq-based RFD profiles (light blue and grey lines, respectively).

