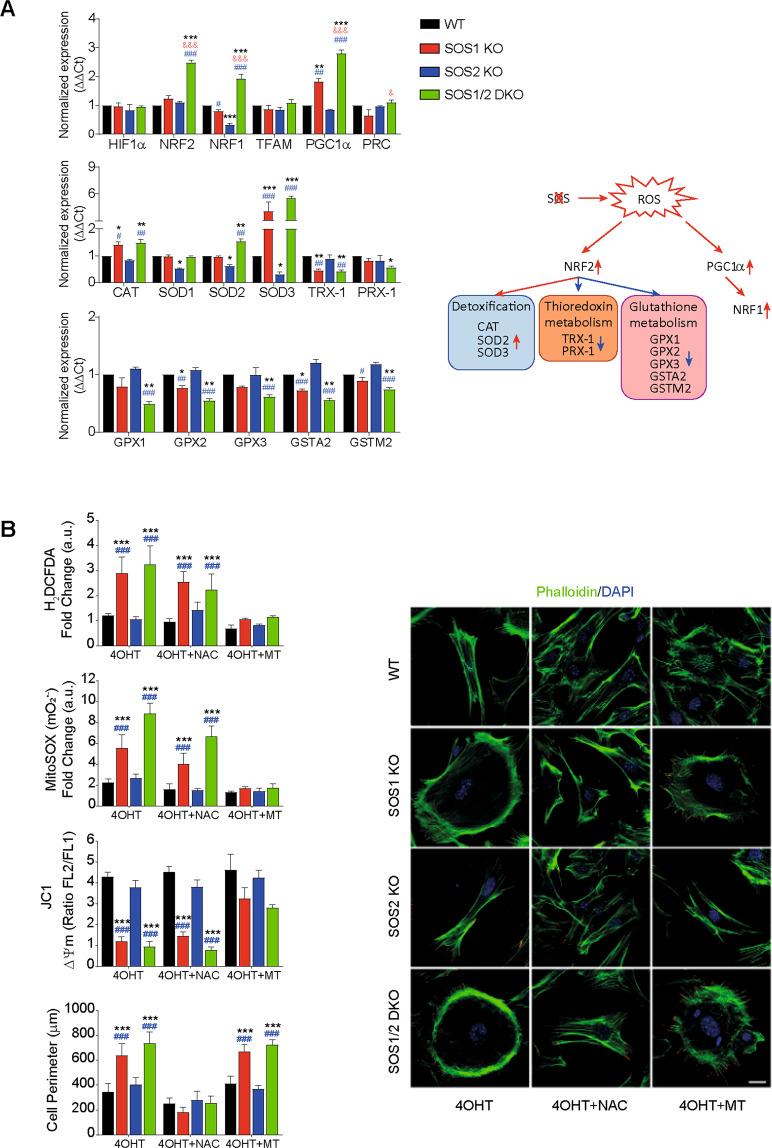
Fig. 1. Altered redox phenotypes of SOS1-devoid MEFs (A) and their reversion by antioxidants (B).
A Expression of cellular antioxidant response elements in MEFs of the four relevant SOS1/2 genotypes. mRNA expression levels of the indicated transcription factors known to participate in hypoxia or antioxidant homeostatic responses (HIF1α, NRF2), mtDNA replication (NRF1, TFAM), or mitochondrial biogenesis (PGC1α), as well as antioxidant and detoxifying enzyme isoforms (CAT, SOD, TRX, PRX, GPX, GST) were determined by quantitative RT-PCR analysis of RNA samples extracted from MEFs of the four relevant SOS genotypes (WT, SOS1-KO, SOS2-KO, SOS1/2-DKO). The expression levels of β-2-microglobulin and β-actin were used as internal controls for normalization in all cases. Sequence of the oligonucleotide primers used in RT-qPCR assays are shown in Supplementary Table S1. A schematic representation of antioxidant pathways depicting the participation in those pathways and the alterations of expression undergone by those players in the absence of SOS1 is also presented. Data represent the mean ± SEM resulting from five independent experiments. * vs WT; & vs SOS1-KO; # vs SOS2-KO; ***,&&&,###p < 0.001; **,##p < 0.01; *,&,#p < 0.05 (n = 5). B Rescue of altered redox phenotypes by NAC and MitoTEMPO superoxide scavengers. Primary MEFs of the four relevant SOS genotypes (WT, SOS1-KO, SOS2-KO, SOS1/2-DKO, color-coded as indicated) were left untreated (similar 4OHT tamoxifen treatment for SOS1-KO induction applied to all genotypes to discard off-target effects) or treated with 10 mM NAC (4OHT + NAC) or 100 µM MitoTEMPO (4OHT + MT) as described in Materials and Methods. Left: in vivo quantitation of redox parameters carried out by means of FACS fluorescence measurements performed (10,000 events in each case) on 9-day 4OHT-treated MEFs cultures using specific fluorophores for intracellular ROS (H2DCFDA, 5 μM), mitochondrial superoxide-(MitoSOXTM, 5 μM), and mitochondrial membrane potential (ΔΨm) (JC1, 3 μM) as described in Materials and Methods. Y-axis units in the bar plots represent normalized values calculated as the ratio between the MFI signals measured in MEFs cultured in the presence of 4OHT (SOS1-depleted) and the same MEFs cultured in the absence of 4OHT (SOS1 being expressed). Data are expressed as mean ± SEM of four different experiments (n = 4). Right: representative confocal microscopy images of MEFs of the four relevant genotypes co-stained for Phalloidin (green) and DAPI (blue). Scale bar: 25 μm. For quantitation of the changes of cell perimeter caused by antioxidants, we measured individual cells of the four relevant genotypes after growing on culture dishes for 9 days in 4OHT-supplemented DMEM medium in the absence (4OHT) or the presence of NAC (4OHT + NAC) or MitoTEMPO (4OHT + MT). 300 individual cells per genotype were measured in each of six separate experiments (n = 6). Statistics: * vs WT; # vs SOS2-KO. ***,###p < 0.001.

