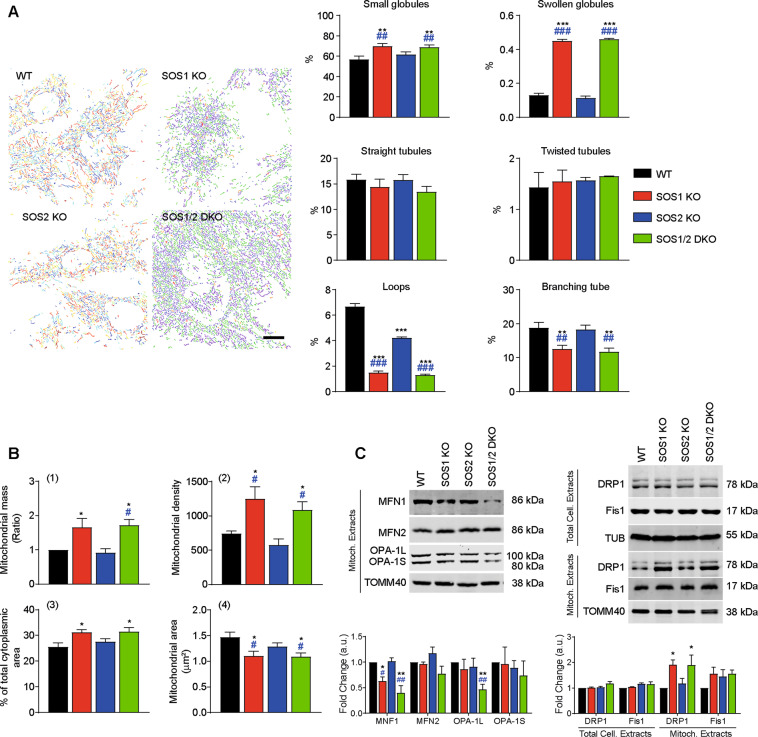
Fig. 2. Specific alterations of mitochondrial shape, mass, and dynamics in SOS1-deficient MEFs.
A Quantitation of mitochondrial morphology subtypes in MEFs of the four relevant SOS genotypes. Left: representative microscopy images of MEFs of the defined genotypes that were immunostained for TOMM40. Immunofluorescence images were filtered and thresholded to obtain segmented images using MicroP tool as described in Materials and Methods. Individual mitochondria were classified according to their shape and size and colored by the software as follows: blue: small globules; yellow: large globules; green: simple tubules; orange: twisted tubules; red: loops; purple: branching tubules. Scale bar: 25 μm. Right: percentage of mitochondrial subtypes of individual cells given different genotypes. In all, 400 individual cells per genotype were measured in each of nine separate experiments. Data expressed as mean ± SEM. Statistical * vs WT; # vs SOS2-KO. ***,###p < 0.001 **,##p < 0.01 (n = 9). B Alterations of mitochondrial mass and size in MEFs of the four relevant SOS genotypes. Flow cytometry analysis performed using MitoTrackerTM Green (for estimation of Mitochondrial Mass) and TOMM40 antibody (for imaging analysis of mitochondrial structures per cell, distribution and size). 1 Mitochondrial mass: the fluorescence intensity of 10,000 cell stained in vivo with MitoTrackerTM Green was quantified by flow cytometry. The total mass of mitochondria was estimated based on MIF values normalized to WT. Data are the mean ± SEM. 2–4 Cells fixed and immunostained with TOMM40 antibody were analyzed with Image J software to quantitate different parameters as shown. Mitochondrial density: number of mitochondrial structures per cell; percentage of total cytoplasmic area occupied by mitochondria in the cells. Mitochondrial area: mean area occupied by each individual mitochondrial structure in the cells. Data represent the mean ± SEM of ten sets of experiments. Statistics: * vs WT; # vs SOS2-KO. *,#p < 0.05 (n = 10). C Altered levels of mitochondrial fusion and fission regulators in MEFs of the four relevant SOS genotypes. Representative western immunoblots using specific antibodies against mitochondrial MFN1, MFN2, OPA1 (fusion markers) as well as DRP1 and FIS1 (fission markers) in total cellular extracts (total cell extracts) or mitochondrial extracts (mitoch. extracts) from MEFs of the indicated genotypes. TOMM40 and Tubulin were used as loading controls, respectively. Data expressed relative expression vs WT as mean ± SEM. Statistics: * vs WT; # vs SOS2-KO; **,##p < 0.01; *,#p < 0.05 (n = 8).

