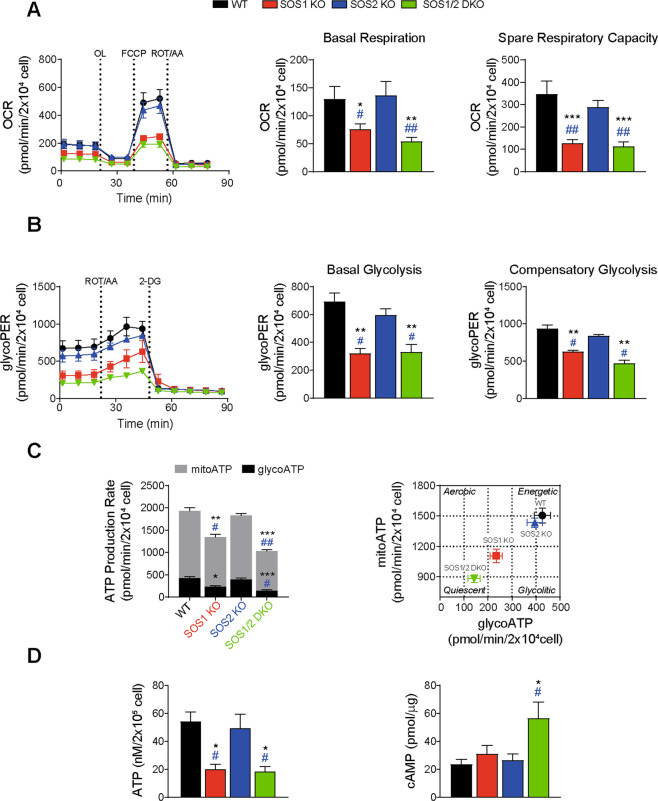
Fig. 5. Specific respiratory and metabolic profiles of SOS1-deficient MEFs.
A Respiration rates. Left: Seahorse XF Cell Mito Stress Test performed on primary MEFs of the indicated genotypes. 20,000 cells/well were seeded and incubated for 24 h. OCR (oxygen consumption rate) was measured under basal conditions followed by the sequential addition of 1.5 µM Oligomycin (OL), 1 µM FCCP, and 1 µM Rotenone and Antimycin A (ROT/AA) following manufacturer’s instruction. Right: quantitation of parameters for basal respiration and spare respiratory capacity. Data presented are the mean ± SEM from six independent experiments using at least five technical replicates per experiment per condition. Statistics: * vs WT; & vs SOS1-KO; # vs SOS2-KO; ***,###p < 0.001; **,&&,##p < 0.01; *,&p < 0.05 (n = 6). B Glycolytic rates. Left: Seahorse XF glycolytic rate assay performed on primary MEFs of the indicated genotypes. 20,000 cells/well were seeded and incubated for 24 h. ECAR (extracellular acidification rate) was measured under basal conditions followed by the sequential addition of 1 µM Rotenone and Antimycin A (ROT/AA), and 100 mM 2-deoxyglucose (2-DG) following the manufacturer’s instructions. Right: quantitation of glycolytic proton efflux rate (glycoPER) and individual parameters for basal glycolysis and compensatory glycolysis. Data expressed as the mean ± SEM compiled from five independent experiments using at least five technical replicates per experiment per condition. Statistics: * vs WT; # vs SOS2-KO; **p < 0.01; #p < 0.05 (n = 5). C ATP production rates. Left: Seahorse XF real-time ATP rate assays of primary MEFs of the indicated genotypes. Rates of mitochondrial ATP production (mitoATP, gray bars) and glycolytic ATP production (glycoATP, black bars) quantitated following manufacturer’s instruction. Right: energetic map of the four genotypes tested charting mitochondrial ATP (mitoATP) versus glycolysis-generated ATP (glycoATP). Data shown are compiled from five independent experiments using at least five technical replicates per experiment per condition. Statistics: * vs WT; # vs SOS2-KO; ***p < 0.001; **,##p < 0.01; *,#p < 0.05 (n = 5). D Intracellular ATP and cAMP levels. Left: measurements of total ATP content (normalized by cell number) in cellular lysates. Right: intracellular cAMP levels measurements (normalized by μg protein) in total cellular lysates. Data shown as the mean ± SEM compiled from eight independent experiments using at least three technical replicates per experiment per genotype. Statistics: * vs WT; # vs SOS2-KO; *,#p < 0.05 (n = 8).

