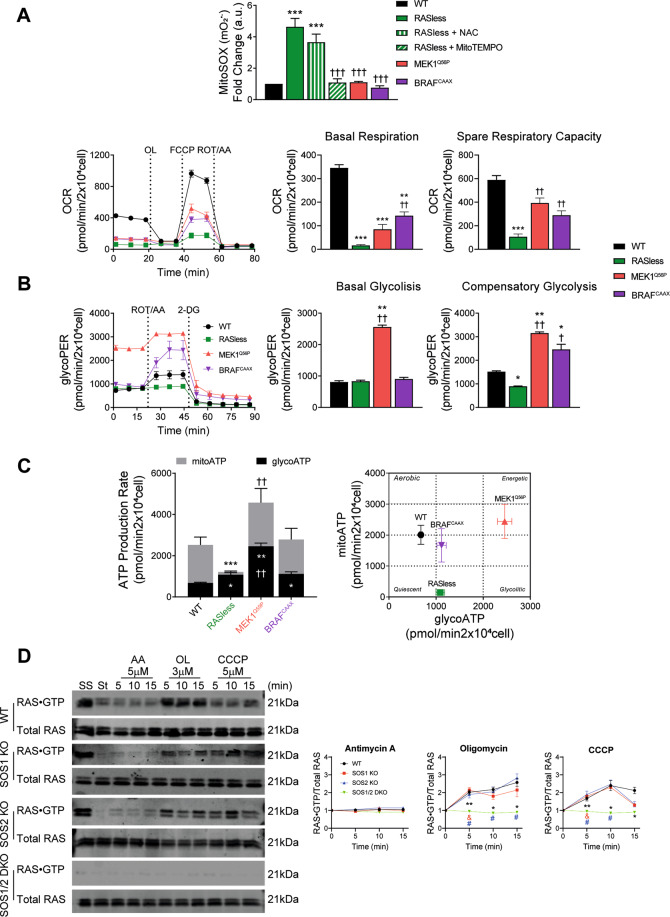
Fig. 7. Specific respiratory and metabolic phenotypes of RASless cells.
A Comparison of redox parameters of WT and RASless MEFs under different experimental conditions. MEF cultures of the indicated genotypes and color codes (control WT cells, black; RASless (H-RAS−/−;N-RAS−/−;K-RASlox/lox) cells, green; RASless cells expressing transfected MEK1Q56P, red; and RASless cells expressing transfected BRAFCAAX, purple) were grown for 12 days in the absence or presence of 4OHT as indicated in each case and tested for various redox, metabolic, and mitochondrial phenotypes as shown here. Upper row: quantitation of mitochondrial superoxide O2•– production. FACS fluorescence measurements performed (10,000 events in each case) using the specific mitochondrial fluorophore MitoSOXTM (5 μM) as described in Materials and Methods. The effect of treatment of RASless cells with a general antioxidant (10 mM NAC, green vertical lines) and a specific mitochondrial superoxide scavenger (100 µM MitoTEMPO, green tilted lines) was also tested. Units in the Y-axis represent normalized values calculated as the ratio between the MFI signals produced by each specific MEF cell line after growing in the presence of 4OHT (KRAS-depleted) or in the absence of 4OHT (KRAS still being expressed). Lower row: measurement of respiratory rates. Left: Seahorse XF Cell Mito Stress Tests performed on MEF cultures of the indicated genotypes after growing for 12 days in the presence of 4OHT. 20,000 cells/well were seeded and incubated in Seahorse testing cartridges for 24 h before performing OCR measurements under basal conditions followed by the sequential addition of 1.5 µM Oligomycin (OL), 1 µM FCCP, and 1 µM Rotenone and Antimycin A (ROT/AA). Right: quantitation of parameters for basal respiration and spare respiratory capacity. Data presented are the mean ± SEM from five independent experiments using at least five technical replicates per experiment per condition. Statistics: * vs WT; † vs RASless; ***,†††p < 0.001; **,††p < 0.01.(n = 5). B Glycolytic rates. Left: Seahorse XF glycolytic rate assays performed on WT and RASless MEFs. 20,000 cells/well were seeded and incubated for 24 h in Seahorse microplates before measuring ECAR under basal conditions followed by the sequential addition of 1 µM Rotenone and Antimycin A (ROT/AA), and 100 mM 2-deoxyglucose (2-DG). Right: quantitation of glycolytic proton efflux rate (glycoPER) and individual parameters for basal glycolysis and compensatory glycolysis of cells. Data expressed as mean ± SEM and compiled from six independent experiments using at least five technical replicates per experiment per genotype. Statistics: * vs WT; † vs RASless; **,††p < 0.01; *,†p < 0.05 (n = 6). C ATP production rates. Left: Seahorse XF real-time ATP production rate tests performed on WT and RASless MEFs. 20,000 cells/well were seeded and incubated for 24 h in Seahorse microplates before measuring ECAR (for estimation of glycoATP under basal, untreated conditions) and OCR (for estimation of mitoATP) followed by the sequential addition of 1 µM Rotenone and Antimycin A (ROT/AA), and 100 mM 2-deoxyglucose (2-DG). Right: bioenergetic phenotypic maps charting mitoATP vs glycoATP values for each MEF genotype. Data expressed as mean ± SEM and compiled from six independent experiments using at least five technical replicates per experiment per genotype. Statistics: * vs WT; † vs RASless; ***p < 0.001; **,††p < 0.01; *p < 0.05 (n = 6). D RAS activation assays. Representative western blots (left) and densitometric analysis (right) of assays of RAS•GTP formation assays performed in WT and SOS-deficient MEFs in the presence of inhibitors of the electron transport chain. Primary MEFs of the indicated genotypes grown for 9 days in the presence of 4OHT were starved overnight and then treated for the times indicated with the specific inhibitors of the ETC including Antimycin A (AA, 5 µM), Oligomycin (OL, 3 µM), and CCCP (5 µM). Subsequent analysis of RAS•GTP formation was done by means of pull-down assays using beads loaded with the RBD region of RAF and a specific pan-RAS antibody as described in Materials and Methods. The graphs present normalized data of the kinetics of RAS•GTP formation after exposure to the indicated inhibitors, quantitated in each case as the ratio between the densitometric signals corresponding to RAS•GTP complexes and to total RAS in the western immunoblots. Data expressed are the mean ± SEM from six independent experiments performed using at least four different MEF lines per genotype. SS, steady state growing cultures. St, starved cultures. Statistics: * vs WT; & vs SOS1-KO; # vs SOS2-KO; **p < 0.01. *,&,#p < 0.05 (n = 6).

