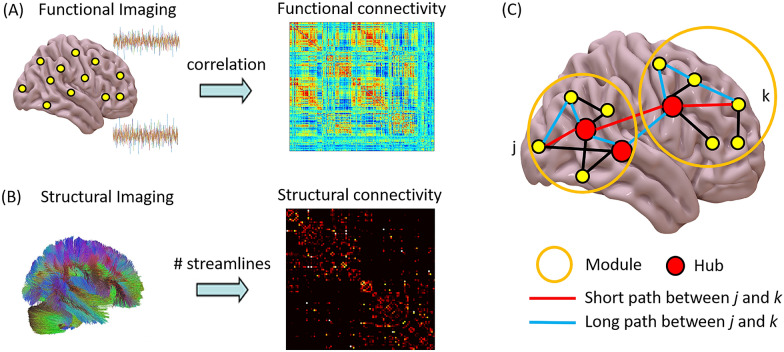
Fig. 3.
Connectivity in the human brain. a Functional connectivity can be quantified from functional neuroimaging, for example, as the Pearson correlation between regional blood-oxygen-level-dependent time series from functional magnetic resonance imaging (MRI). b Structural connectivity can be quantified from structural imaging, for example, as the number of streamlines between regions, estimated by using diffusion MRI. c Network analysis can provide information about individual nodes (e.g., identification of high-degree nodes, or “hubs”) as well as mesoscopic properties (e.g., modular organization) and macroscale (e.g., average length of shortest path between nodes)

