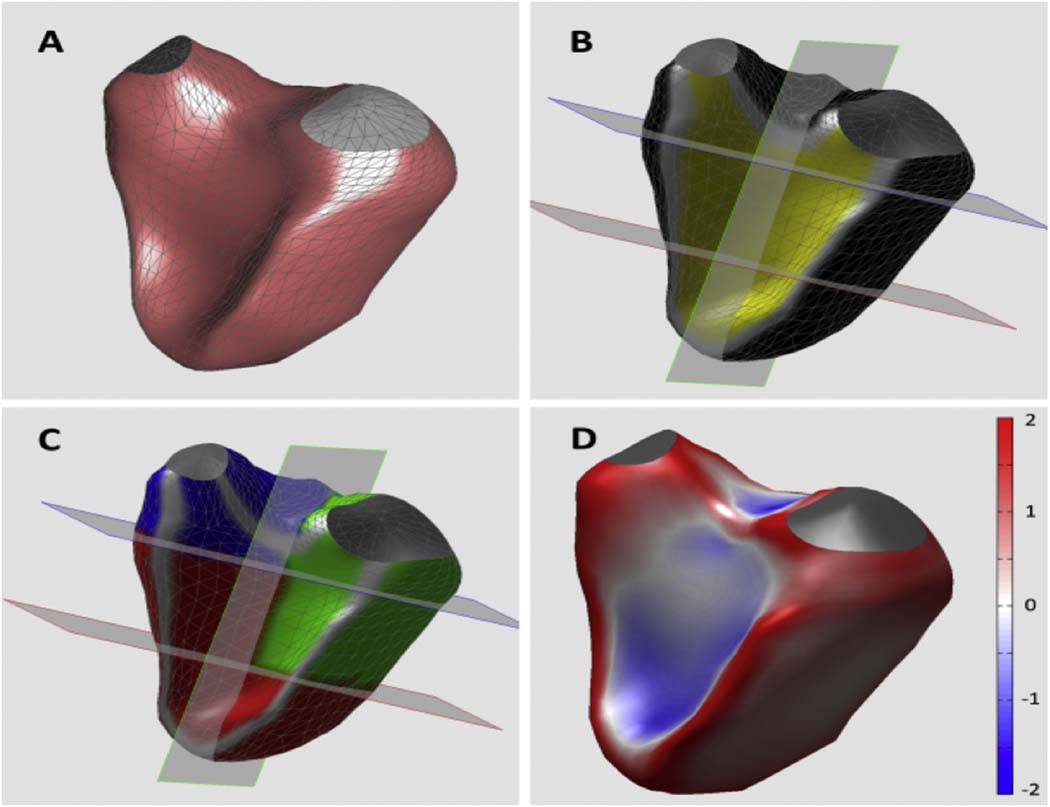
Figure 2.
3D analysis of regional RV volume and shape. Reconstructed 3D RV surface (A) was divided into 6 segments (B) and used to measure volumes in 3 RV regions: inlet (green), outflow (blue) and trabecular (red) regions (see text for details). Curvature was calculated for each point of the RV surface: see color-encoded RV cast (D).

