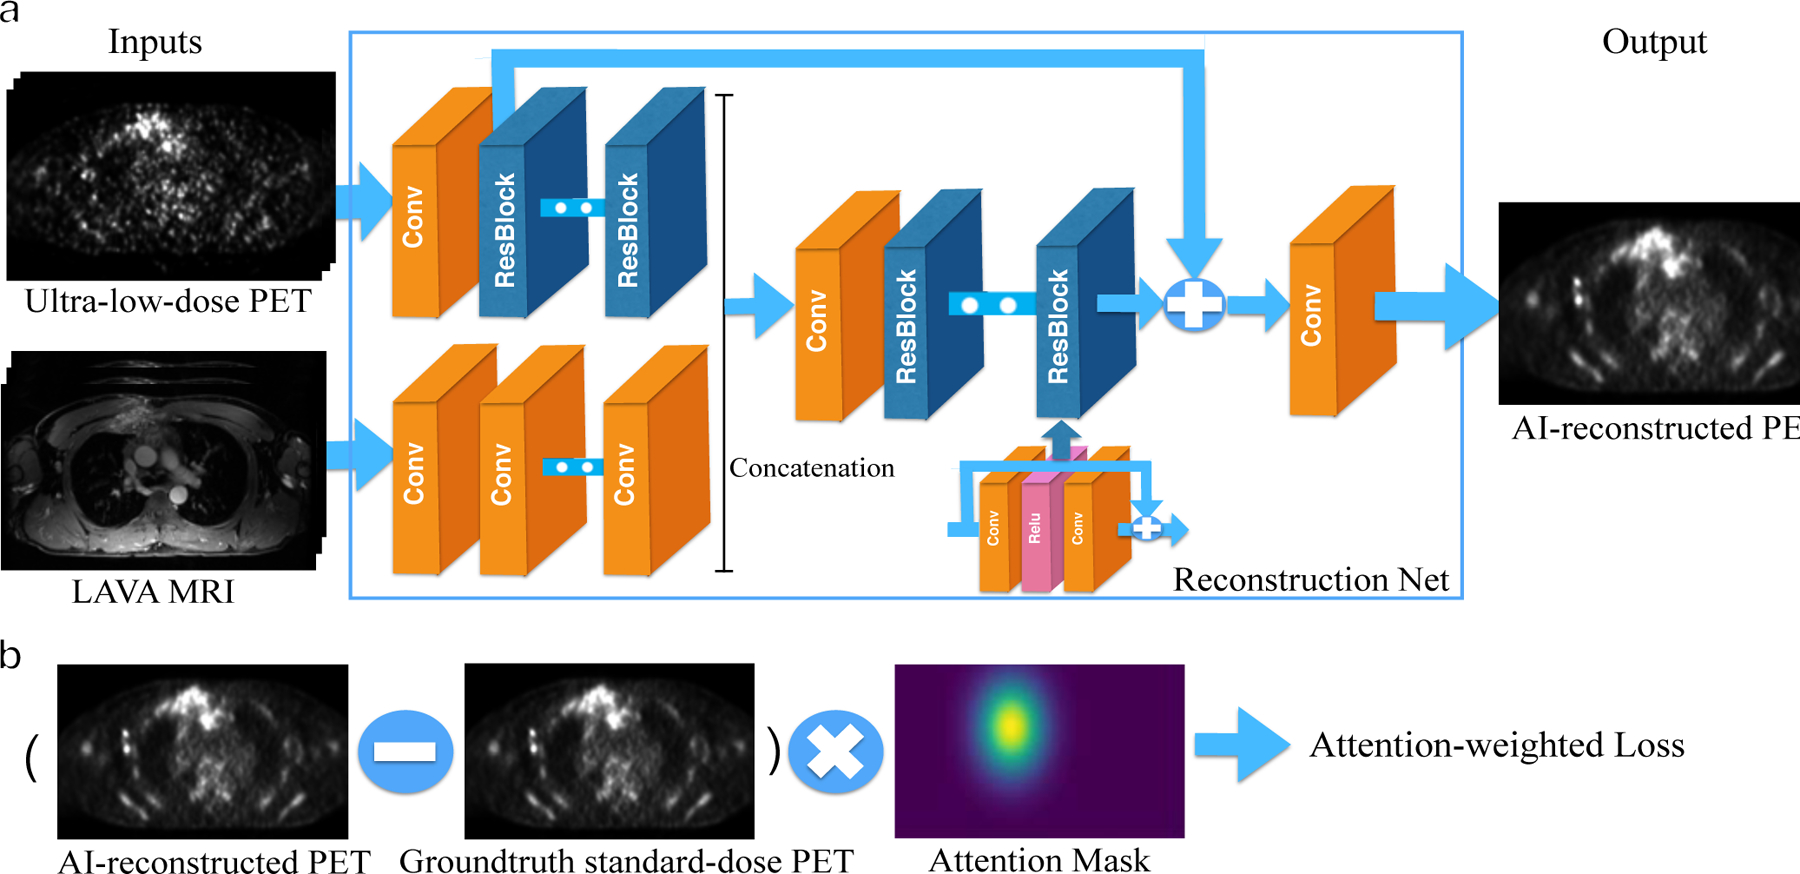
FIGURE 1. The pipeline of the CNN reconstruction net.

a). The evaluation framework of the PET reconstruction CNN. It inputs the simulated ultra-low-dose 18F-FDG PET and contrast-enhanced T1-weighted MRI images and outputs the synthetized standard-dose 18F-FDG PET images. The PET and MRI images are integrated at the mid-level after feature extraction; A skip-connection is added to the CNN in order to connect the ultra-low-dose 18F-FDG PET images with the final reconstruction. b). The calculation process of the attention-weighted loss. The attention mask highlights the tumor area.
