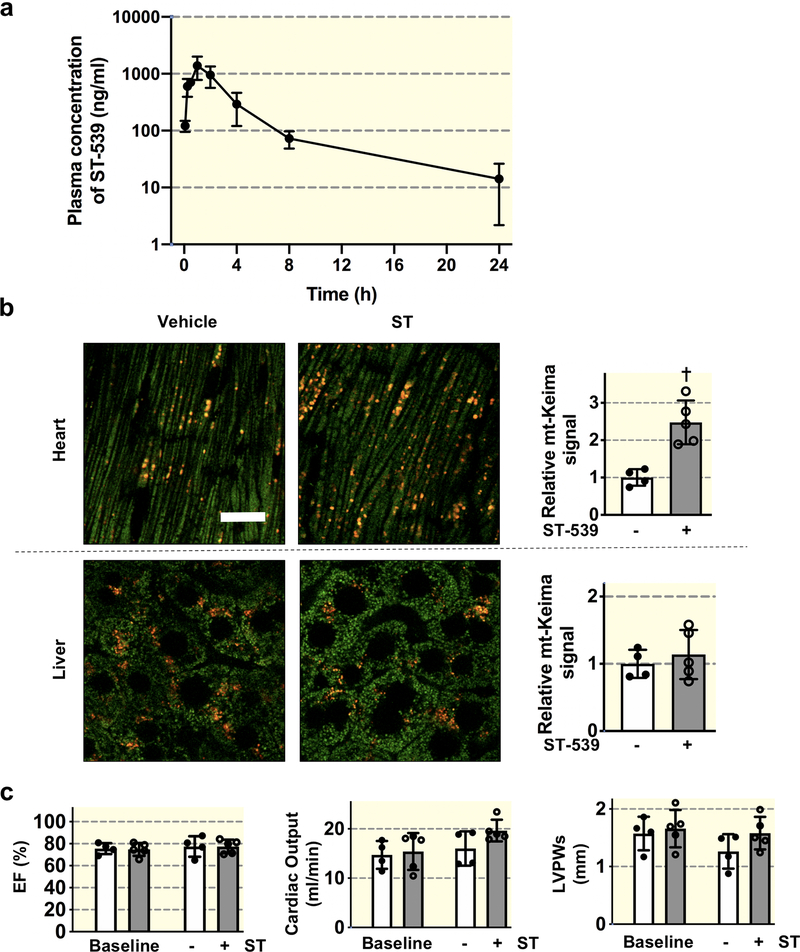
Figure 4. USP30 inhibition promotes cardiac mitophagy.
(a) Plasma ST-539 concentrations as a function of time following 25mg/kg i.p. injection into adult male mice. Concentration determined by LC-MS/MS. n=3 males/time point. Data presented as mean ± s.d. (b) Assessment of mitophagy using mt-Keima mice. Left, representative confocal images of heart and liver tissue from vehicle or ST-539 (25mg/kg/day for 5 days) treated mt-Keima mice; right, quantification of cardiac and hepatic mitophagy. The emission signal obtained after excitation with the 458-nm laser is shown in green, and that obtained after excitation with the 561-nm laser is shown in red. Individual mouse data points are shown. Values are normalized to control levels of mitophagy (n=4 for control and n=5 for ST-539). Scale bars, 20 μm. † p < 0.01. (c) Echocardiographic quantification showing similar percentage ejection fraction (EF) cardiac output and left ventricular posterior wall thickness at end-systole (LVPWs) for vehicle or ST-539 treated mt-Keima mice (n=4 for control and n=5 for ST-539). Data are mean ± s.d. Individual mouse data points are shown.

