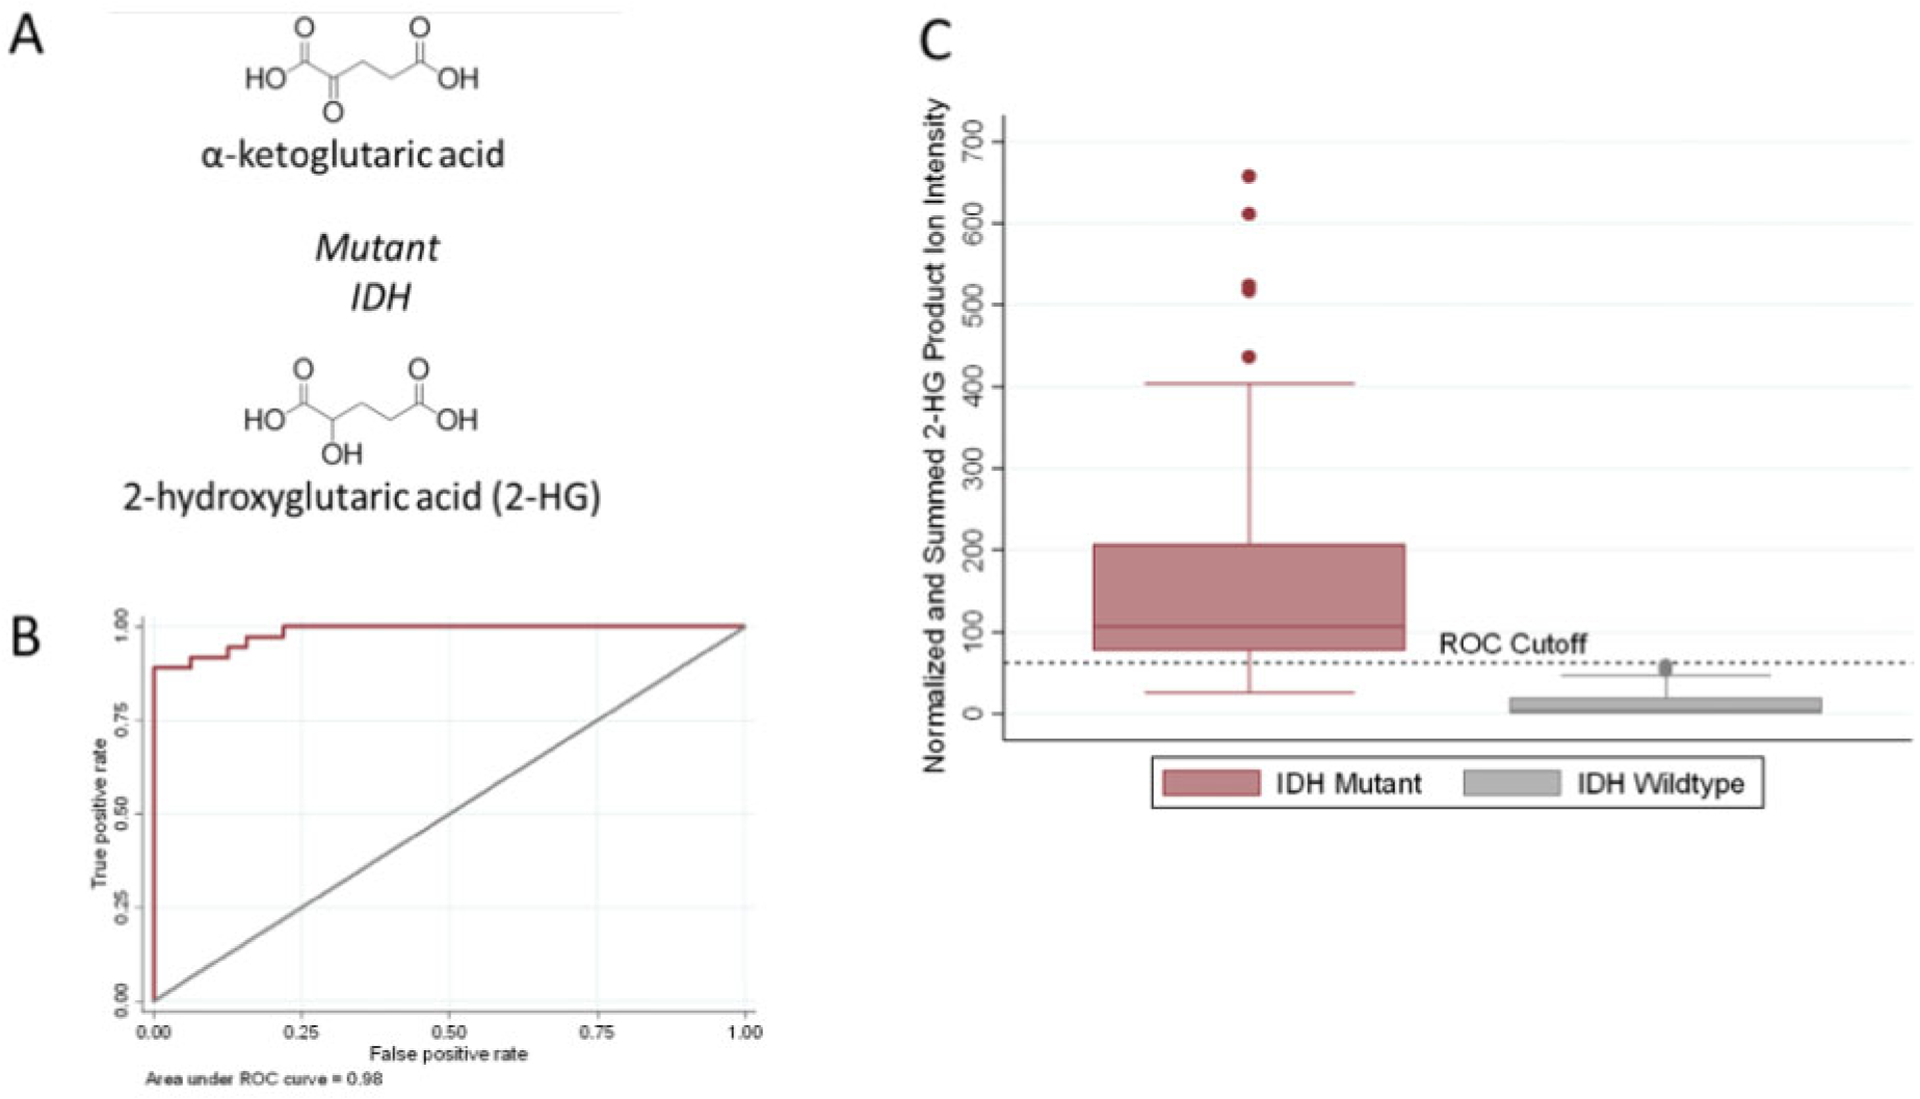
Fig. 2.

Intraoperative assessment of IDH-mutation status from tumor cores. (A) Chemical structure of α-ketoglutaric acid and 2-hydroxyglutarate (2-HG), the oncometabolite associated with IDH mutations. (B) ROC curve for the IDH-mutation assay using the tumor core biopsies. The area under the curve is 0.98, indicating the high accuracy of the method. (C) Box-plot showing the average summed and TIC normalized MS3 fragment ion intensities (m/z 85 + m/z 101) produced by sequential dissociation (MS3) of 2-HG for all tumor core biopsies (n = 68 biopsies from 28 subjects) by IDH mutation status. The fragment ion intensities from duplicate smears of the same biopsy were averaged to generate one value per biopsy. Error bars represent ± 1.5 times the calculated standard deviations. The black dashed horizontal decision line was calculated from ROC curve analysis and differentiates tumor core biopsies from IDH-mut subjects and IDH-wt subjects with the highest sensitivity and specificity.
