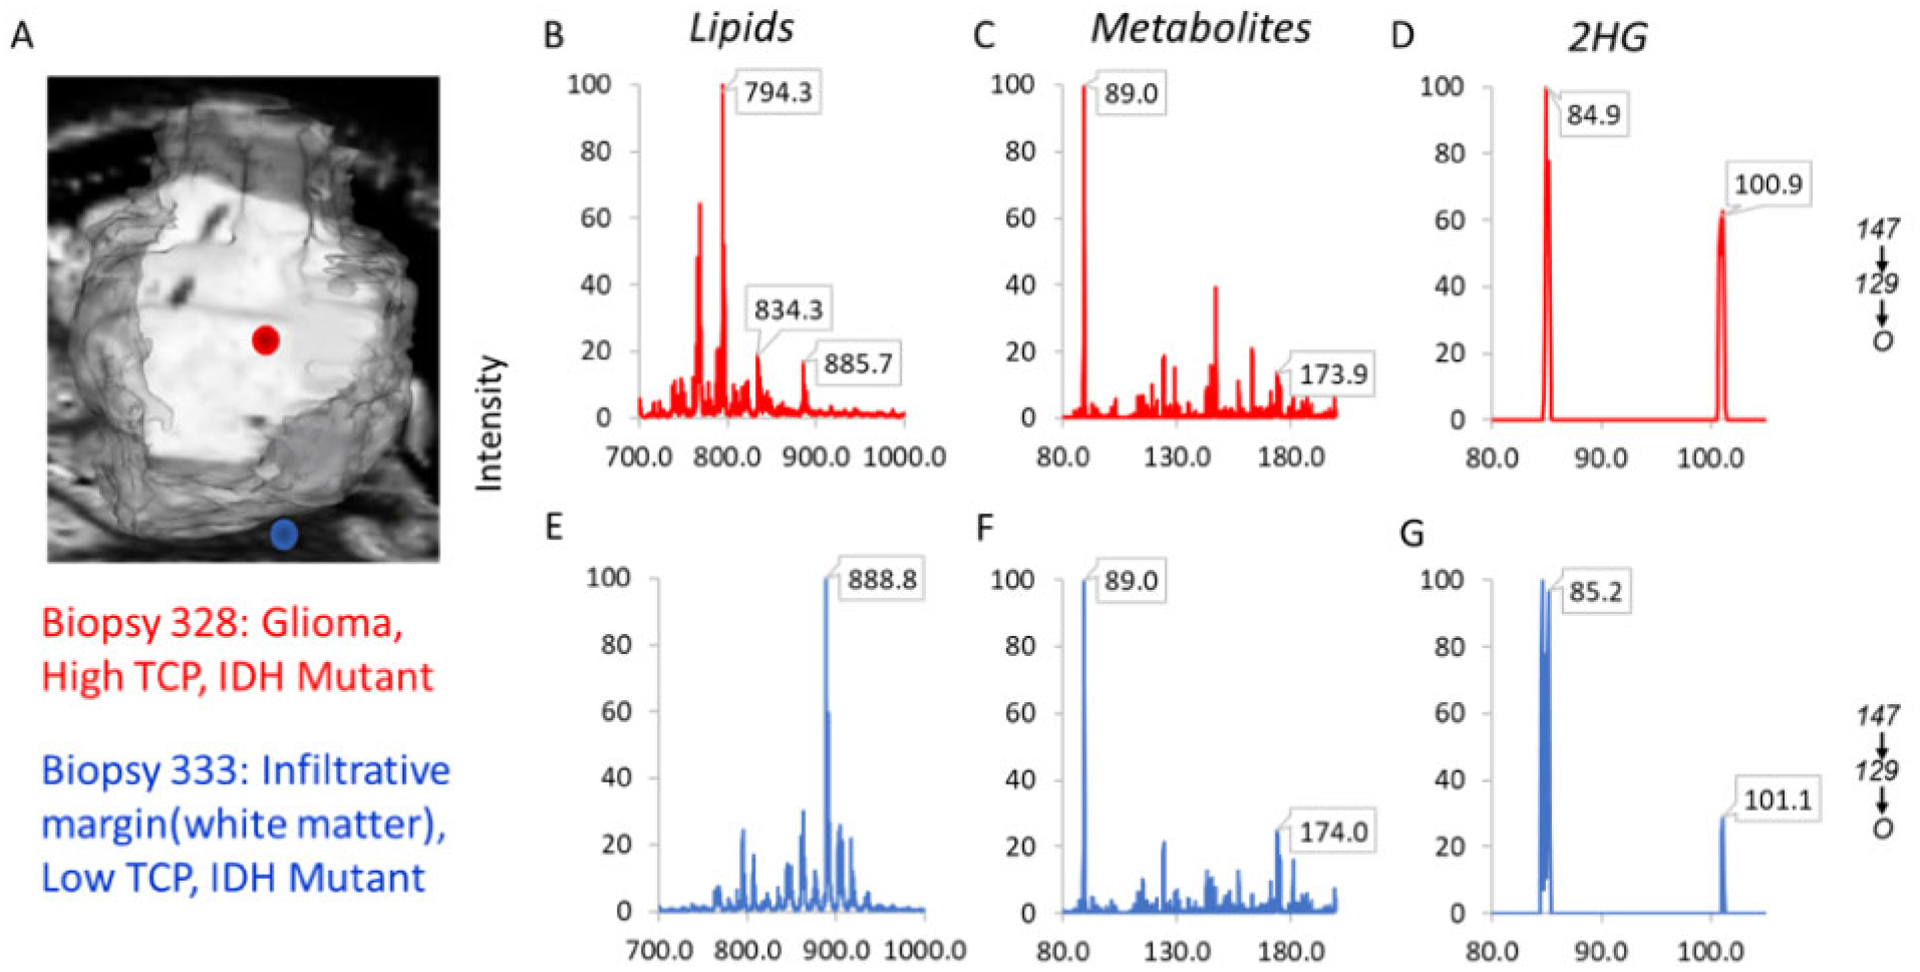
Fig. 3.

DESI-MS predictions of disease status, TCP, and IDH-mutation status for a core and margin biopsy from Subject 58. (A) Reconstruction of MRI tumor volume showing location of the two biopsies. Biopsy 328 (red dot) is within the contrast enhancing region of the tumor; biopsy 333 (blue dot) is a few mm outside of the contrast enhancing region. (B–D) The lipid, metabolite, and MS3 product ion scans for biopsy 328 (red dot in Fig. 2, A). (E–G) The lipid, metabolite, and 2-HG MS3 product ion scan for biopsy 333 (blue dot in Fig. 2, A). Biopsy 328 was classified as glioma, high TCP, and IDH-mut; biopsy 333 was infiltrative margin (white matter), low TCP, and IDH-mut.
