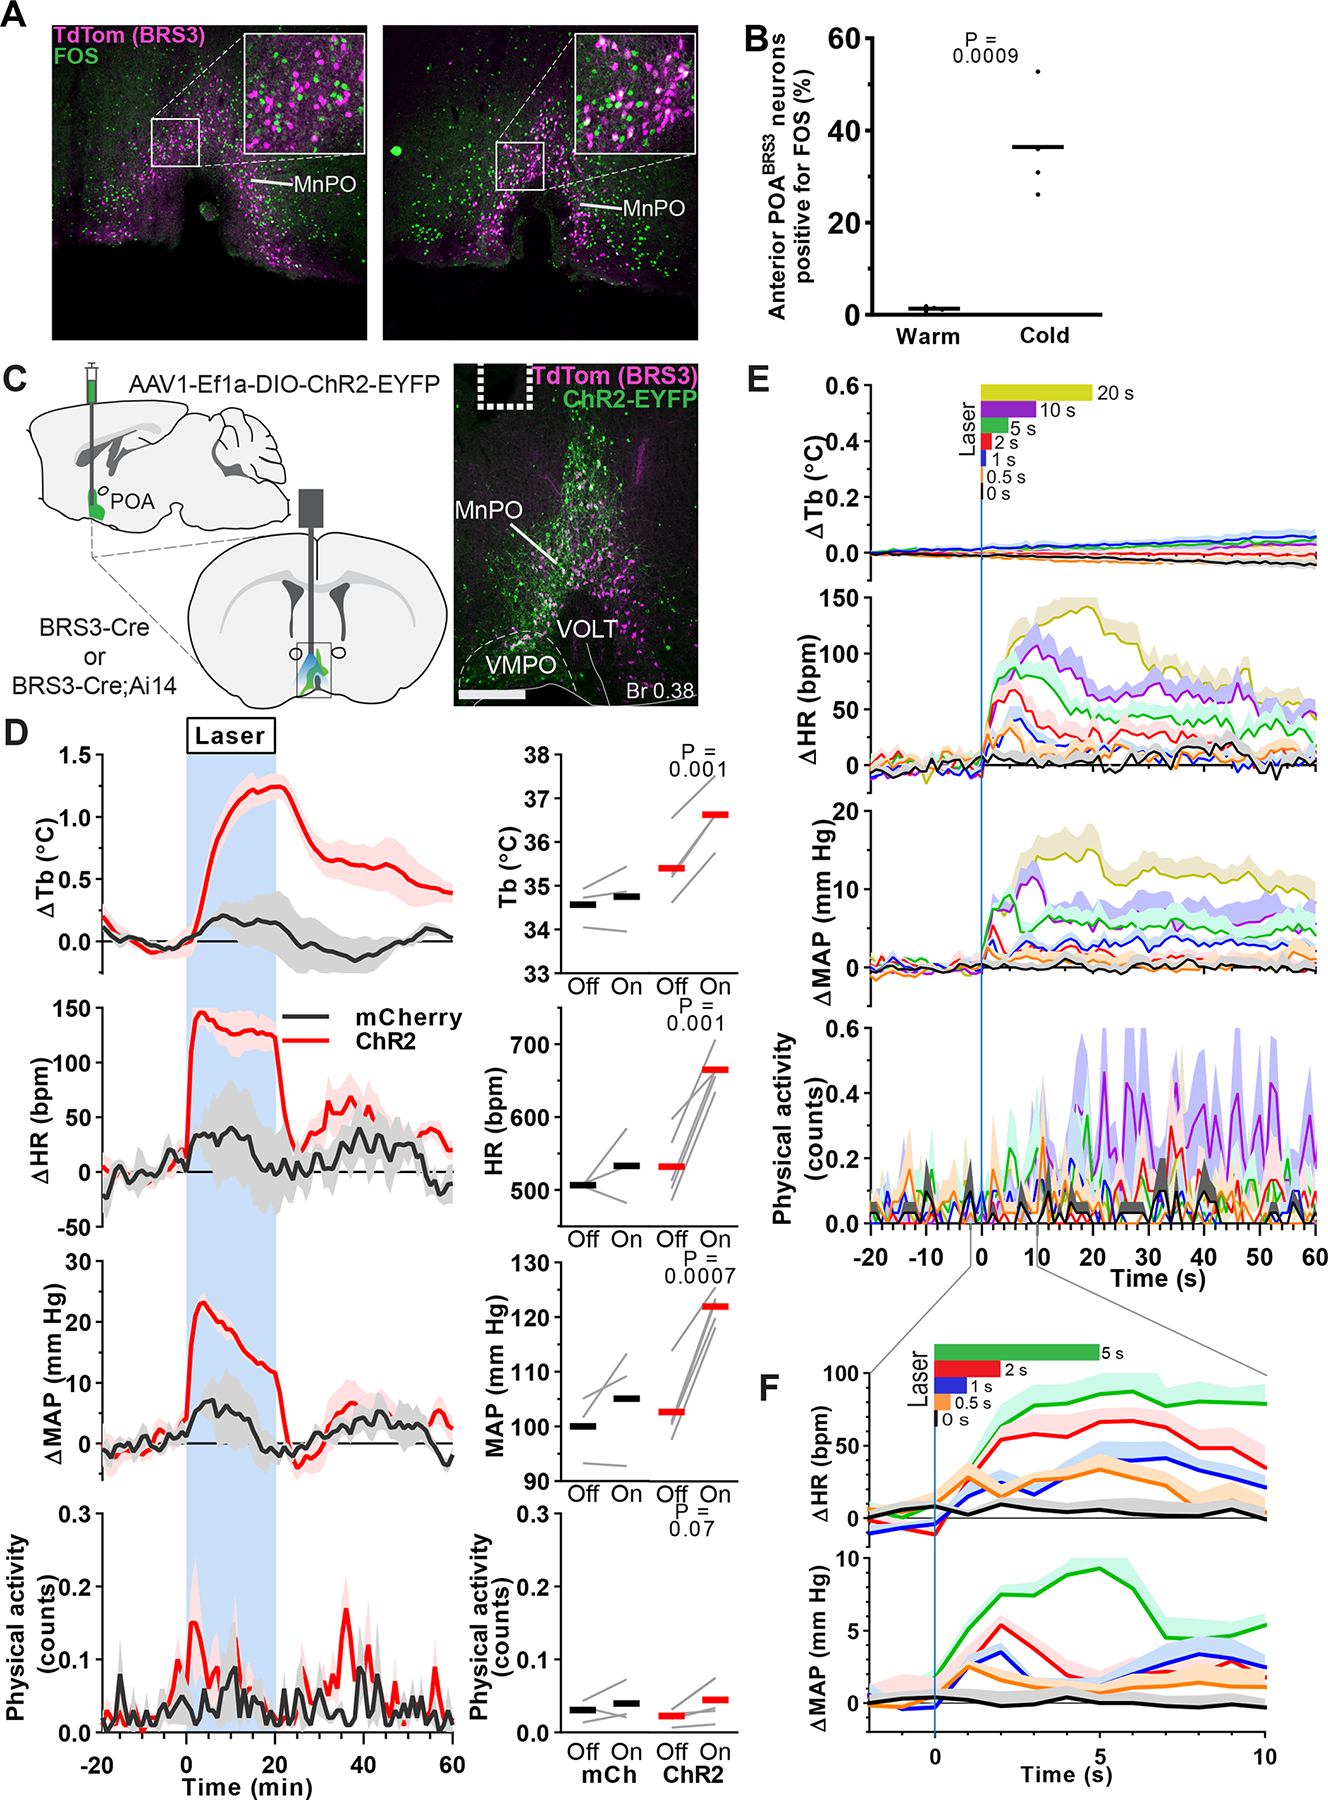
Figure 1.

POABRS3 neurons are cold-sensitive and optogenetic stimulation increases body temperature, heart rate and mean arterial pressure. a) FOS expression (green) in BRS3 neurons (magenta) of 4 h cold- (4 °C) or warm-exposed (30 °C) mice. Scale bar is 200 μm, 80 μm in inset. b) Average and individual percentages of colocalization of FOS in anterior (Bregma +0.50 and +0.38) POABRS3 neurons (n = 4/group). P values from unpaired t test, cold vs warm. Data are re-graphed from (Pinol et al., 2018). c) Schematic of virus injection (top left) and placement of optic fiber (bottom left). ChR2-EYFP expression (green) in BRS3 (magenta) neurons in the MnPO of a BRS3-Cre;Ai14 mouse (right). Dotted line indicates fiber placement. Scale bar is 200 μm. MnPO – median preoptic area; VMPO – ventromedial preoptic area; VOLT – vascular organ of lamina terminalis. d) Tb, HR, MAP, and physical activity response to 20 min laser stimulation (blue interval; 3s on 1s off; 20 Hz; 10 ms pulses). mCherry controls (black, n = 3), ChR2 (red, n = 5). Data are average of 5 epochs/mouse, relative to epoch baseline (−20 to −1 min); mean ± s.e.m. Quantitation in right panels (intervals: Off, −10 to −1 min; On, 10 to 19 min for Tb and 0 to 9 min for HR, MAP, and physical activity; bars, means; gray lines, individual animals; P values from paired t test, Off vs On). e, f) Brief optogenetic stimulation increases HR and MAP, but not Tb or physical activity. Laser (continuous pulses; 20 Hz; 10 ms pulses) stimulation is indicated at top in color-coded bars. Data are mean + s.e.m., n=5 mice (average of 10 epochs/mouse), relative to epoch baseline (−59 to 0 s).
