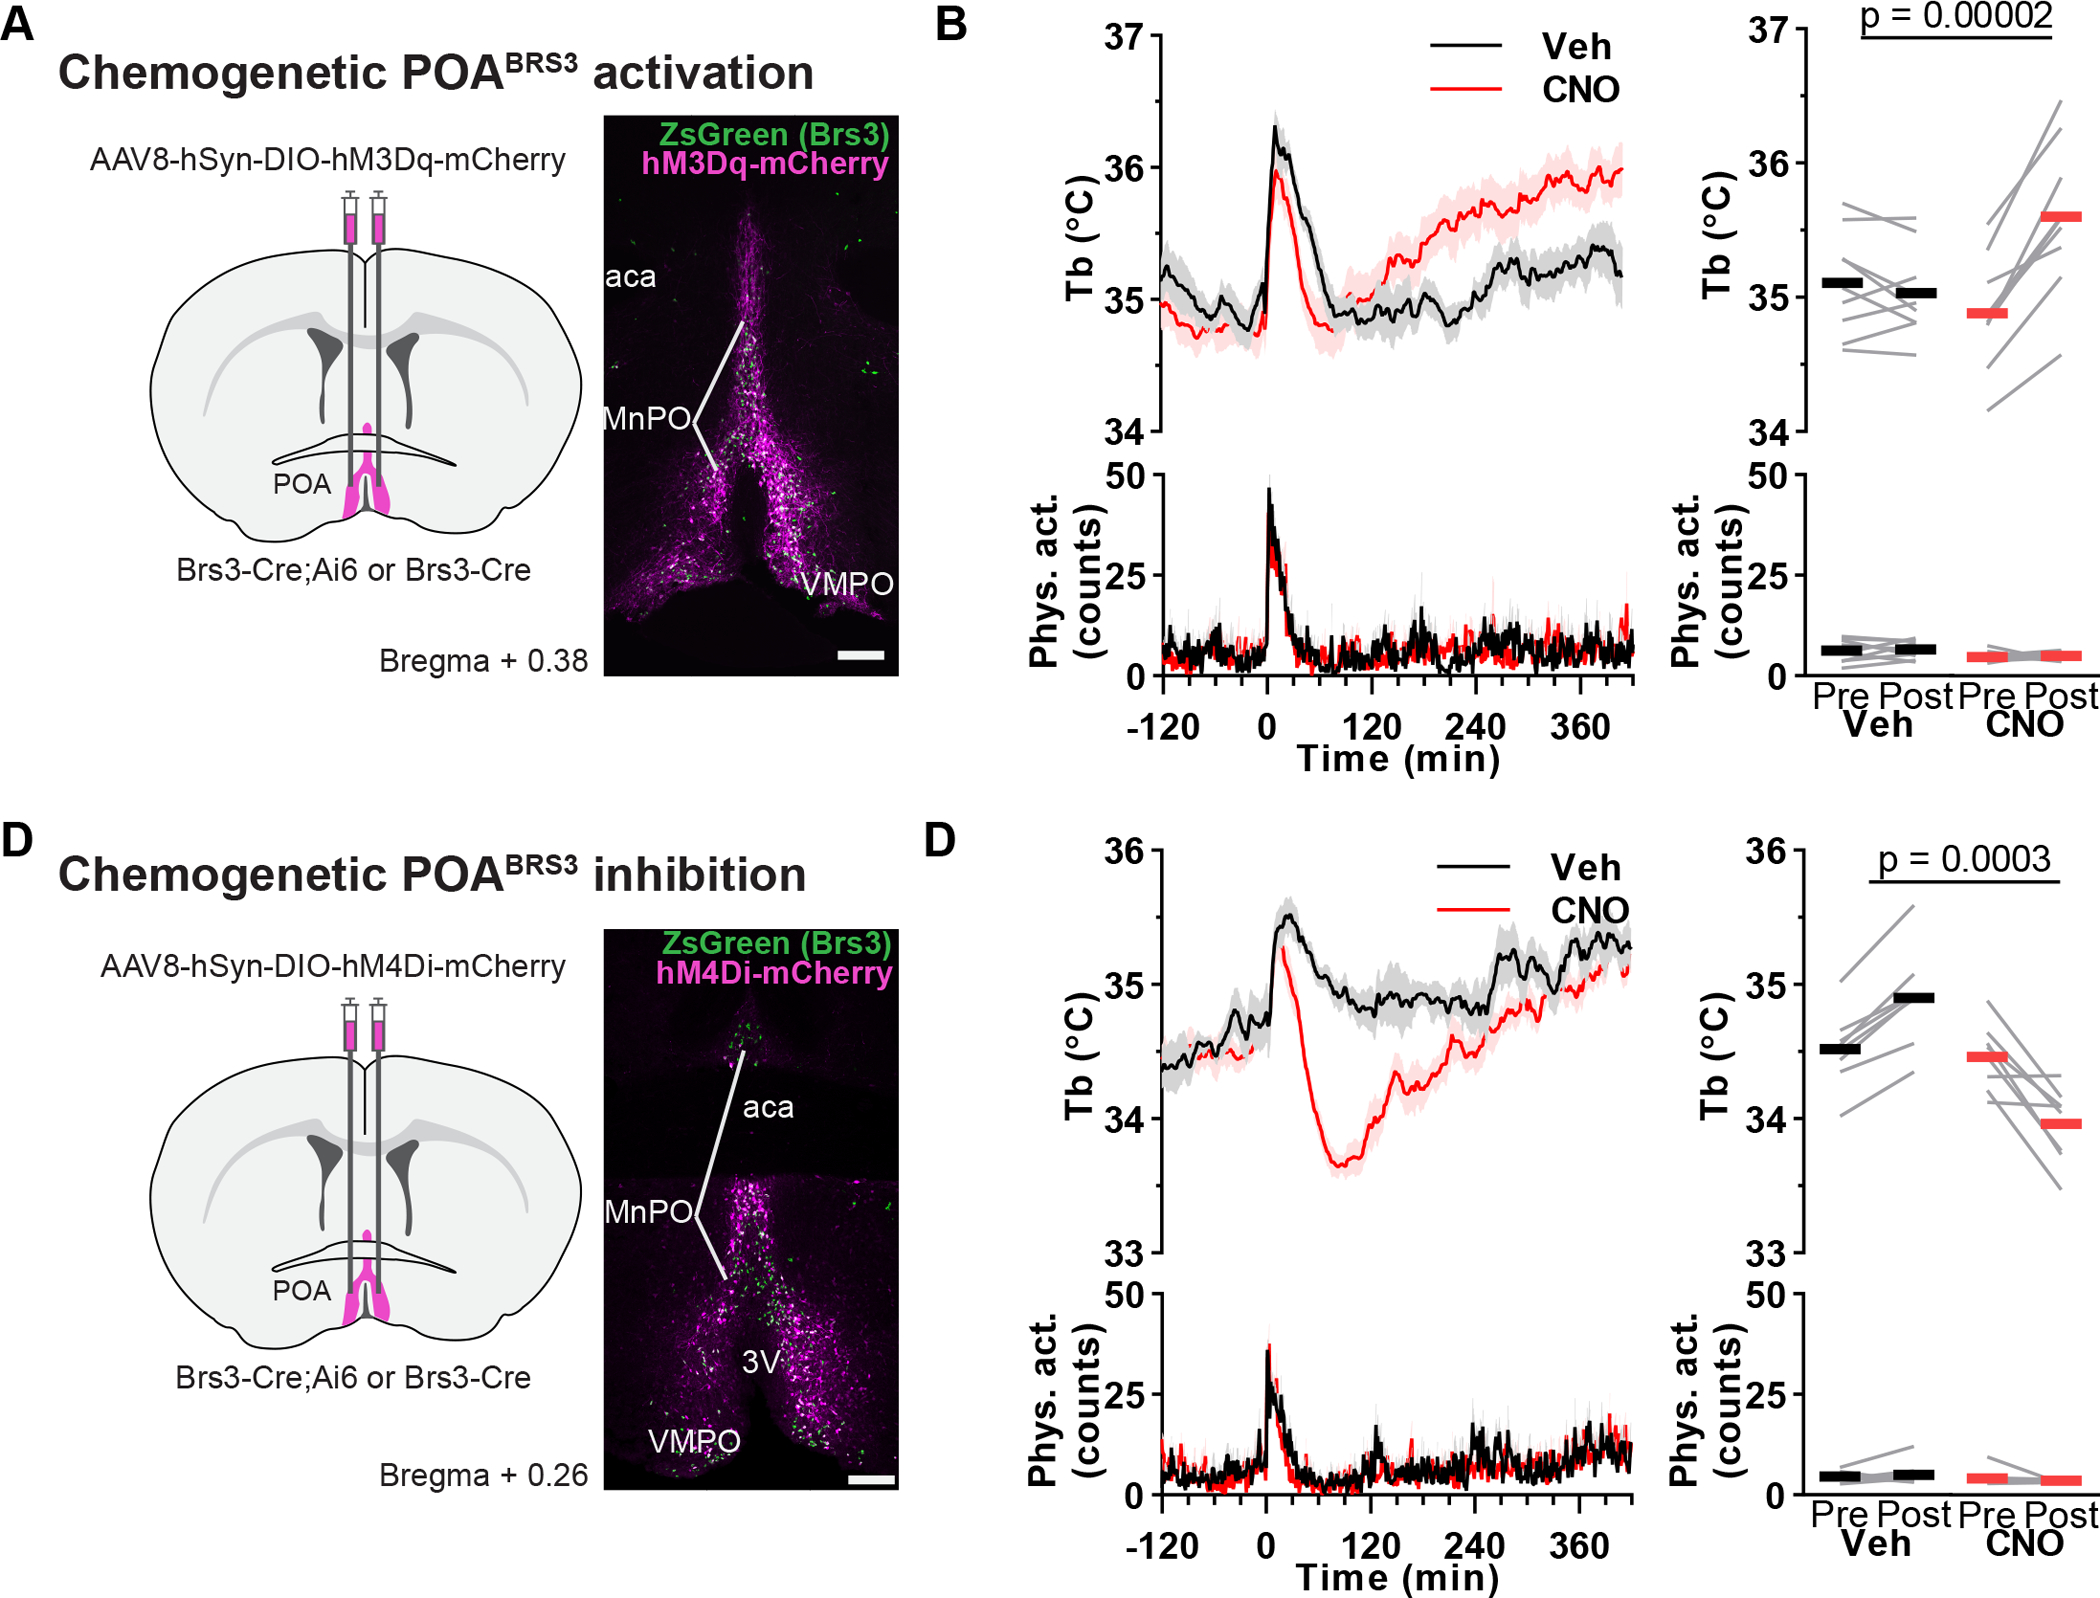
Figure 3.

Bi-directional chemogenetic manipulation of POABRS3 neurons. a,c) Schematic of virus injection and example of hM3Dq-mCherry (a) or hM4Di-mCherry (c) expression (magenta) in BRS3 (green) neurons in the anterior POA of a BRS3-Cre;Ai14 mouse. Scale bar is 200 μm. b,d) Tb and physical activity response to CNO (1 mg/kg) or vehicle in POABRS3::hM3Dq mice (c; n = 9, mean of two or three trials; Pre: −150 to −30; Post: 180 to 300 min) or POABRS3::hM4Di (d; n = 8, mean of three trials; Pre: −150 to −30; Post: 60 to 180 min) mice. P values from paired, two-sided t-test on change from baseline, CNO vs vehicle. Data are mean + s.e.m in bottom left panel and ± s.e.m. in top left panel. Bars, means; gray lines, individual animals in right panels. See also Figure S1.
