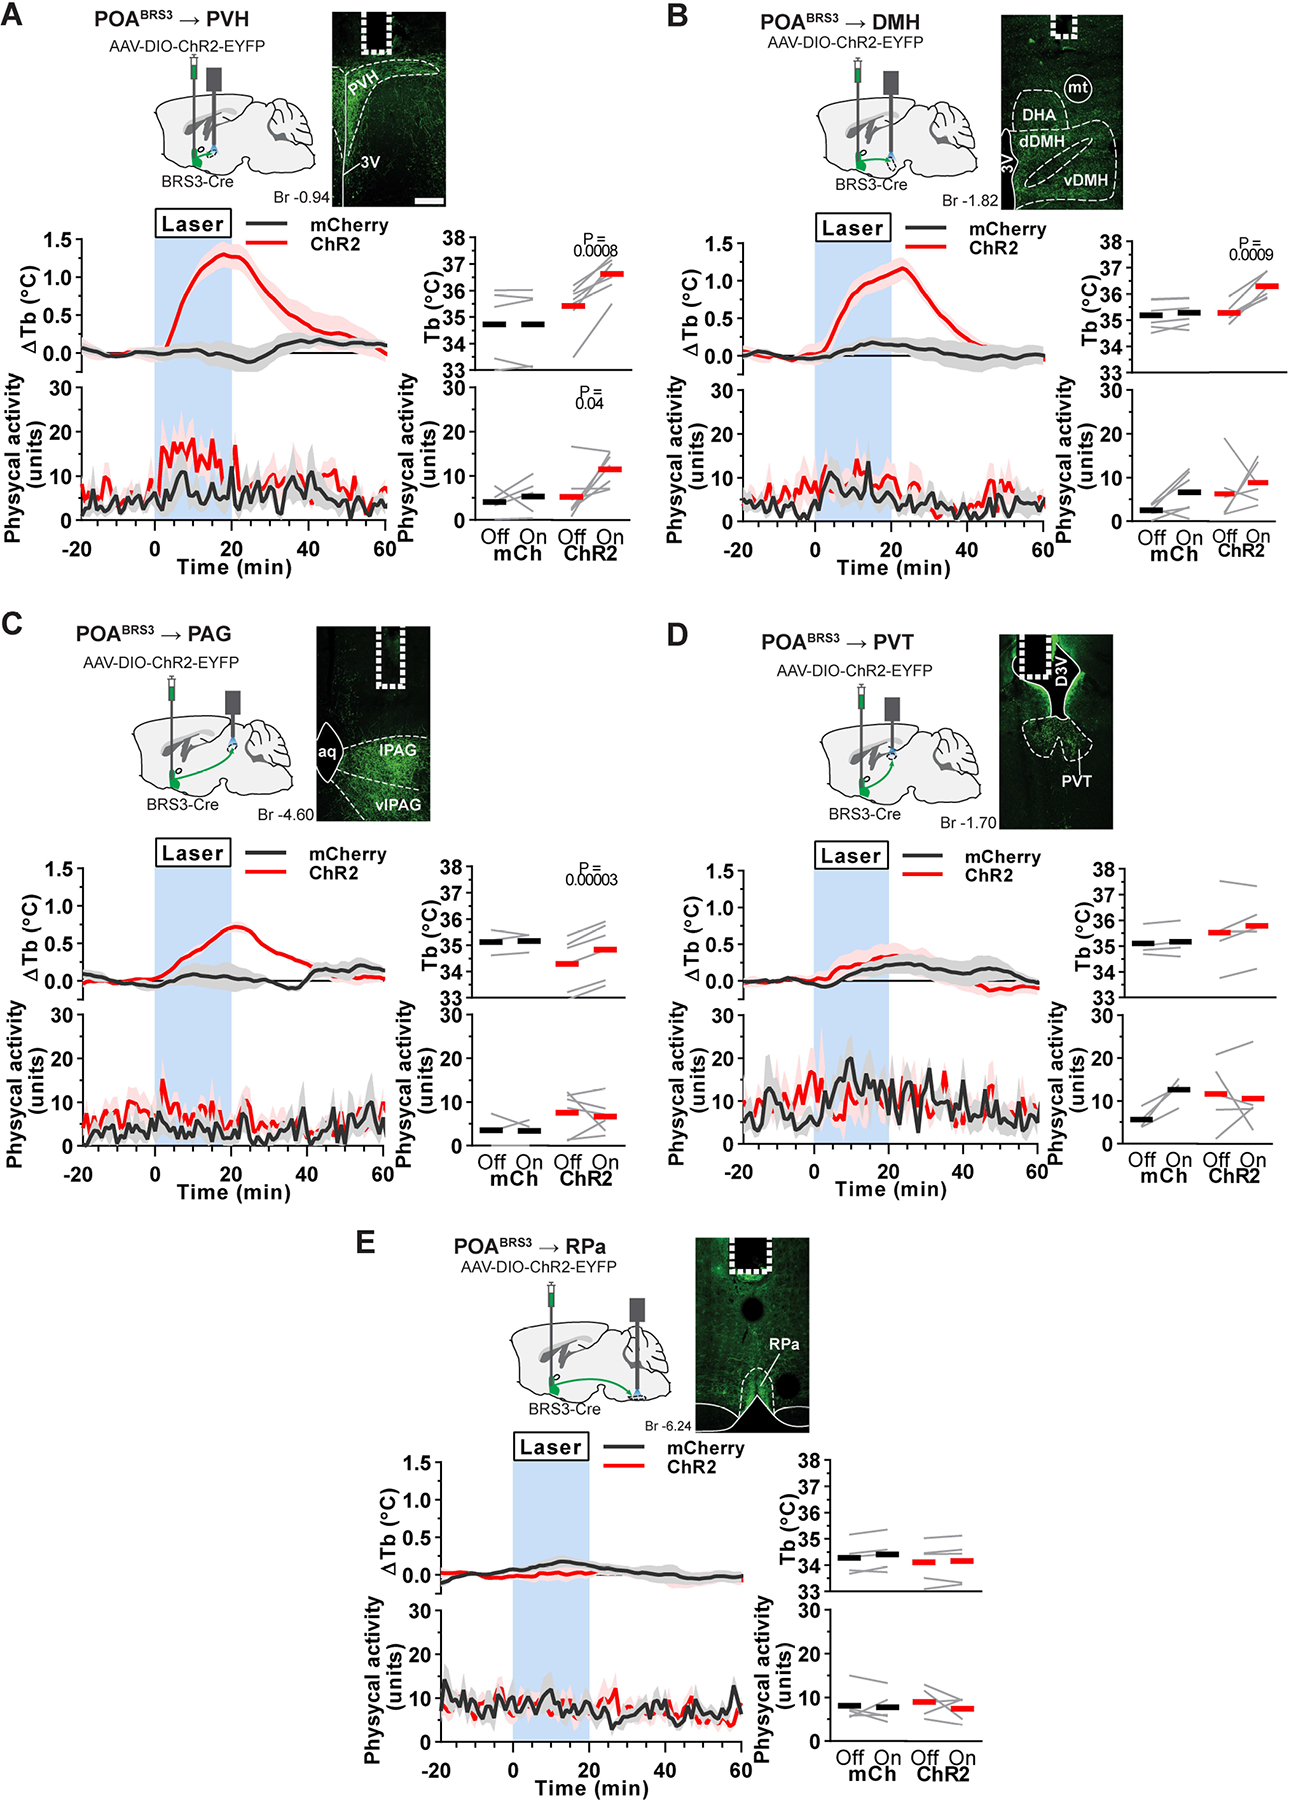
Figure 4.

Optogenetic stimulation of POABRS3→PVH, POABRS3→DMH, or POABRS3→PAG axons increases Tb. a-e) Top left: schematic of virus injection and placement of optic fiber. Top right: POABRS3 projections expressing ChR2-EYFP (green) and fiber placement (dotted line). Scale bar is 200 μm. Bottom left: Tb and physical activity response to 20 min laser stimulation (blue interval; 3s on 1s off; 20 Hz; 10 ms pulses). mCherry controls (black, n = 4–5), ChR2 (red, n = 5–7). Data are average of 5–10 epochs/mouse, relative to epoch baseline (−20 to −1 min); mean ± s.e.m. Quantitation in bottom right panels (intervals: Off, −10 to −1 min; On, 10 to 19 min for Tb and 0 to 9 min for physical activity; bars, means; gray lines, individual animals; P values from paired t test, Off vs On). 3V - third ventricle; Aq – aqueduct; DHA – dorsal hypothalamic area dDMH - dorsal part of the dorsomedial hypothalamus; D3V – dorsal part of third ventricle; PVH – paraventricular nucleus of the hypothalamus; PVT – paraventricular nucleus of the thalamus; lPAG - lateral periaqueductal grey; vDMH – ventral part of the dorsomedial hypothalamus; vlPAG – ventrolateral periaqueductal grey; PVH – paraventricular nucleus of the hypothalamus; RPa – raphe pallidus. See also Figures S2, S3.
