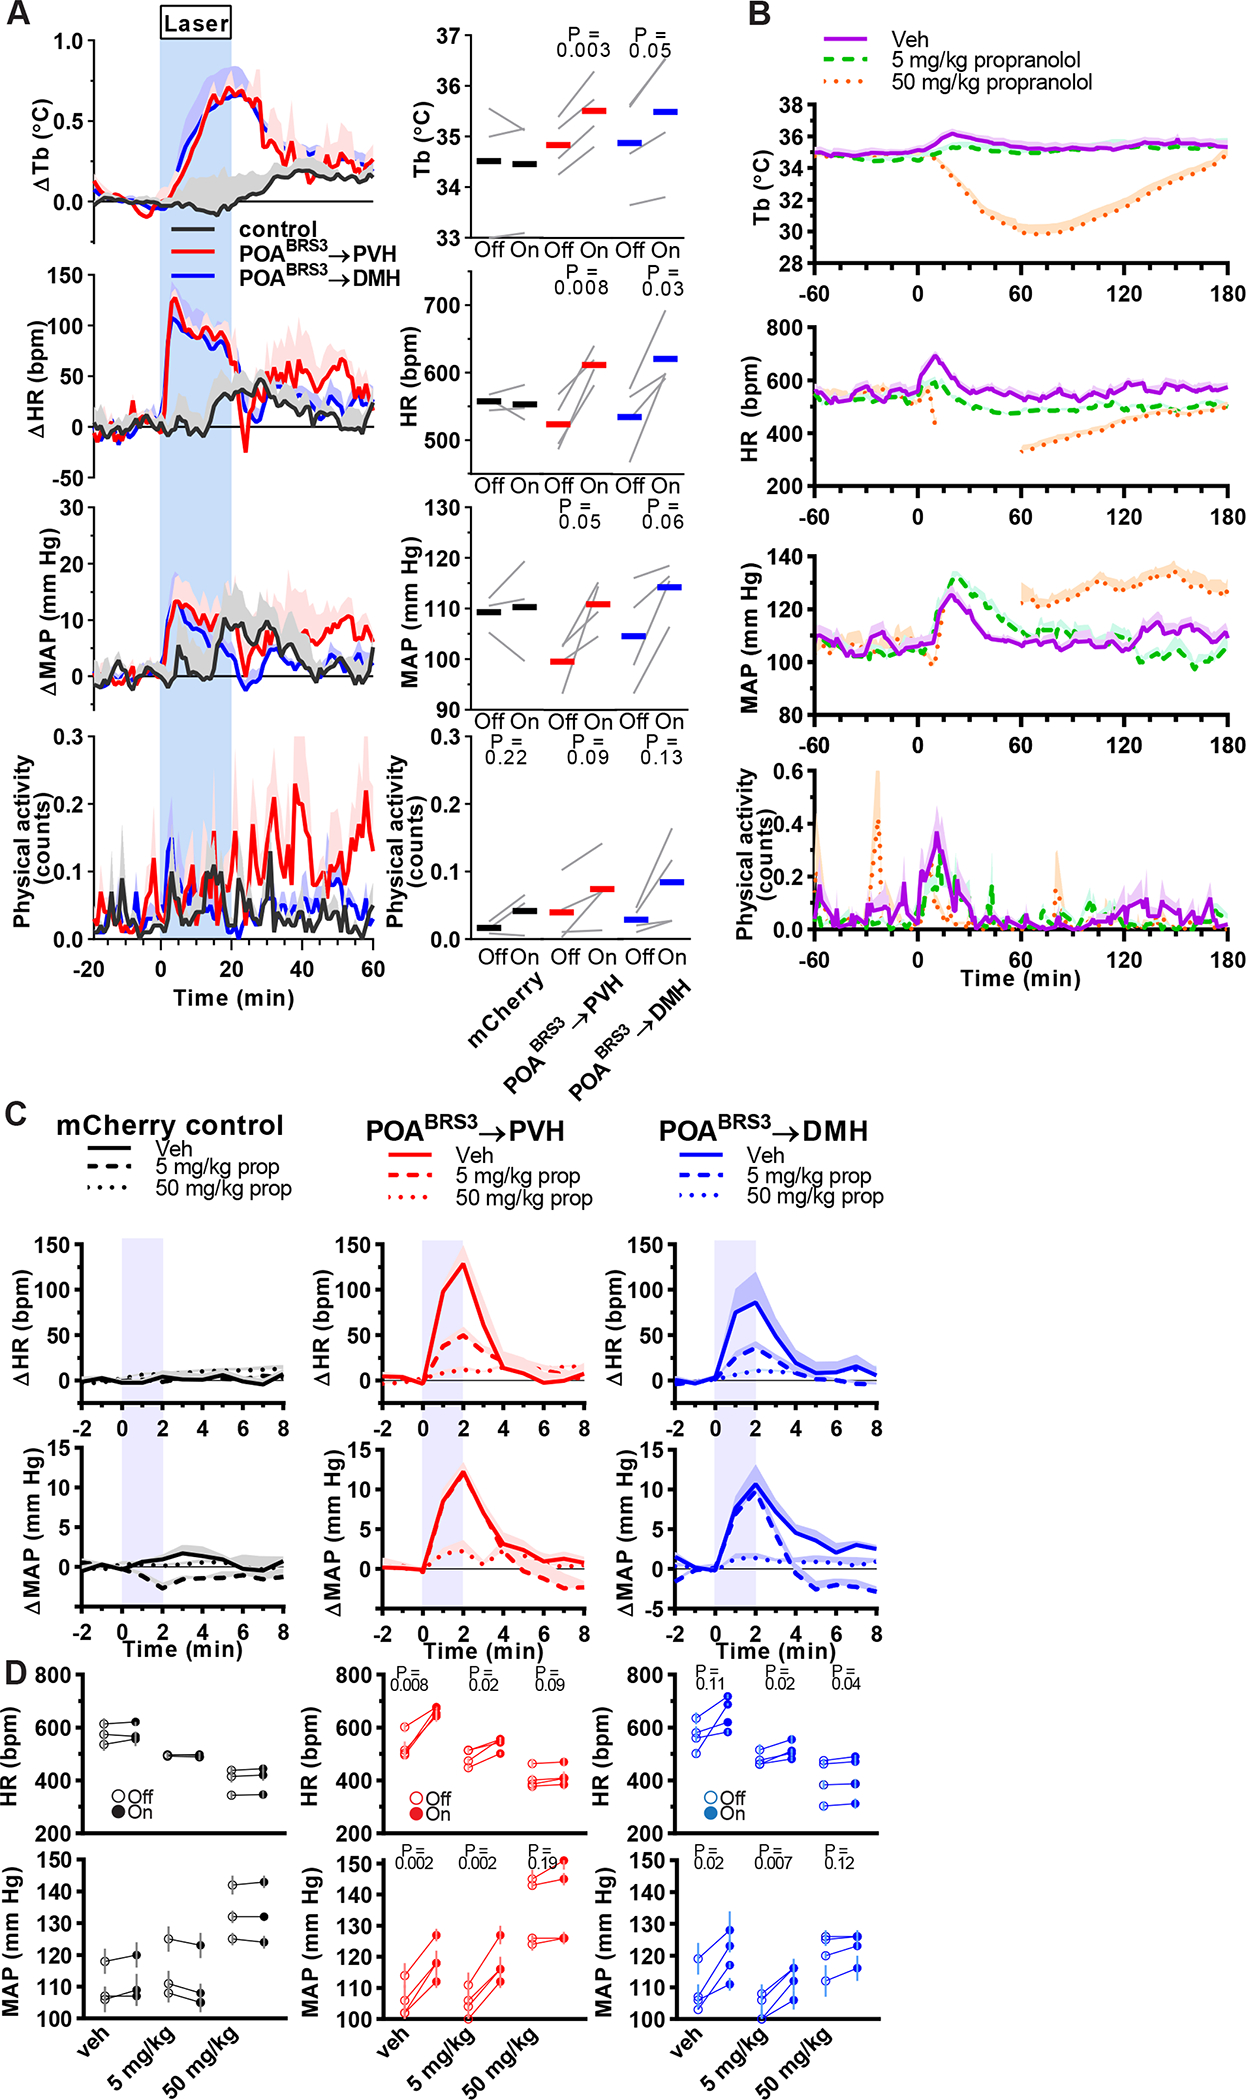
Figure 5.

POABRS3→PVH and POABRS3→DMH neurons increase Tb and HR via the sympathetic nervous system. a) Tb, HR, MAP, and physical activity response to 20 min laser stimulation (blue interval; 3s on 1s off; 20 Hz; 10 ms pulses). mCherry controls (black, n = 3), POABRS3→PVH (red, n = 4), POABRS3→DMH (blue, n = 4); gray lines, individual animals. Data are average of 5 epochs/mouse, relative to epoch baseline (−20 to −1 min); mean ± s.e.m. Quantitation in bottom right panels (intervals: Off, −10 to −1 min; On, 10 to 19 min for Tb and 0 to 9 min for HR, MAP, and physical activity; P values from paired t test, Off vs On). In b-d, propranolol (vehicle, 5, or 50 mg/kg i.p., as indicated) was injected at time 0. Starting at 30 min, consecutive epochs of 2-min laser stimulation (1s on 1s off; 20 Hz; 10 ms pulses) and 8 min laser off were performed. b) Effect of propranolol on Tb, HR, MAP, and physical activity. To isolate the effects of propranolol without confounding by optogenetic stimulation, minutes 6–10 (from laser onset) of each 10-minute epoch are graphed. Time 0 is vehicle/propranolol injection. Data are mean + s.e.m. n=11 mice, pooled data. In the 50 mg/kg group, mean is not graphed between 15–60 min as blood pressure signal was lost in most mice; all mice have MAP and HR data after 60 min. Responses to drug (during 75–155 minutes) were compared to baseline (−60 to 0 minutes) and tested with one-way ANOVA, Tukey’s multiple comparisons test (5 mg/kg: HR, p = 0.03 and MAP, p = 0.45; 50 mg/kg: HR, p < 0.0001). c,d) Effect of stimulating POABRS3→PVH or POABRS3→DMH neurons on HR and MAP during propranolol treatment. mCherry controls (black, n = 3), POABRS3→PVH (red, n = 4), POABRS3→DMH (blue, n = 4). Data are mean + s.e.m. of 8 epochs (during 75–155 min). In c, data in each epoch was normalized to its baseline (−1 to 0 min) and the effect of laser stimulation (blue) is depicted as change from baseline. Data are mean + s.e.m. In d, the individual mouse data are presented. Open symbols are baseline (Off, from −1 to 0 minutes) and closed symbols are stimulated (On, from 1 to 2 minutes). P values from paired t test, Off vs On. Data are mean ± s.e.m. of 8 epochs (during 75–155 min). See also Figure S4.
