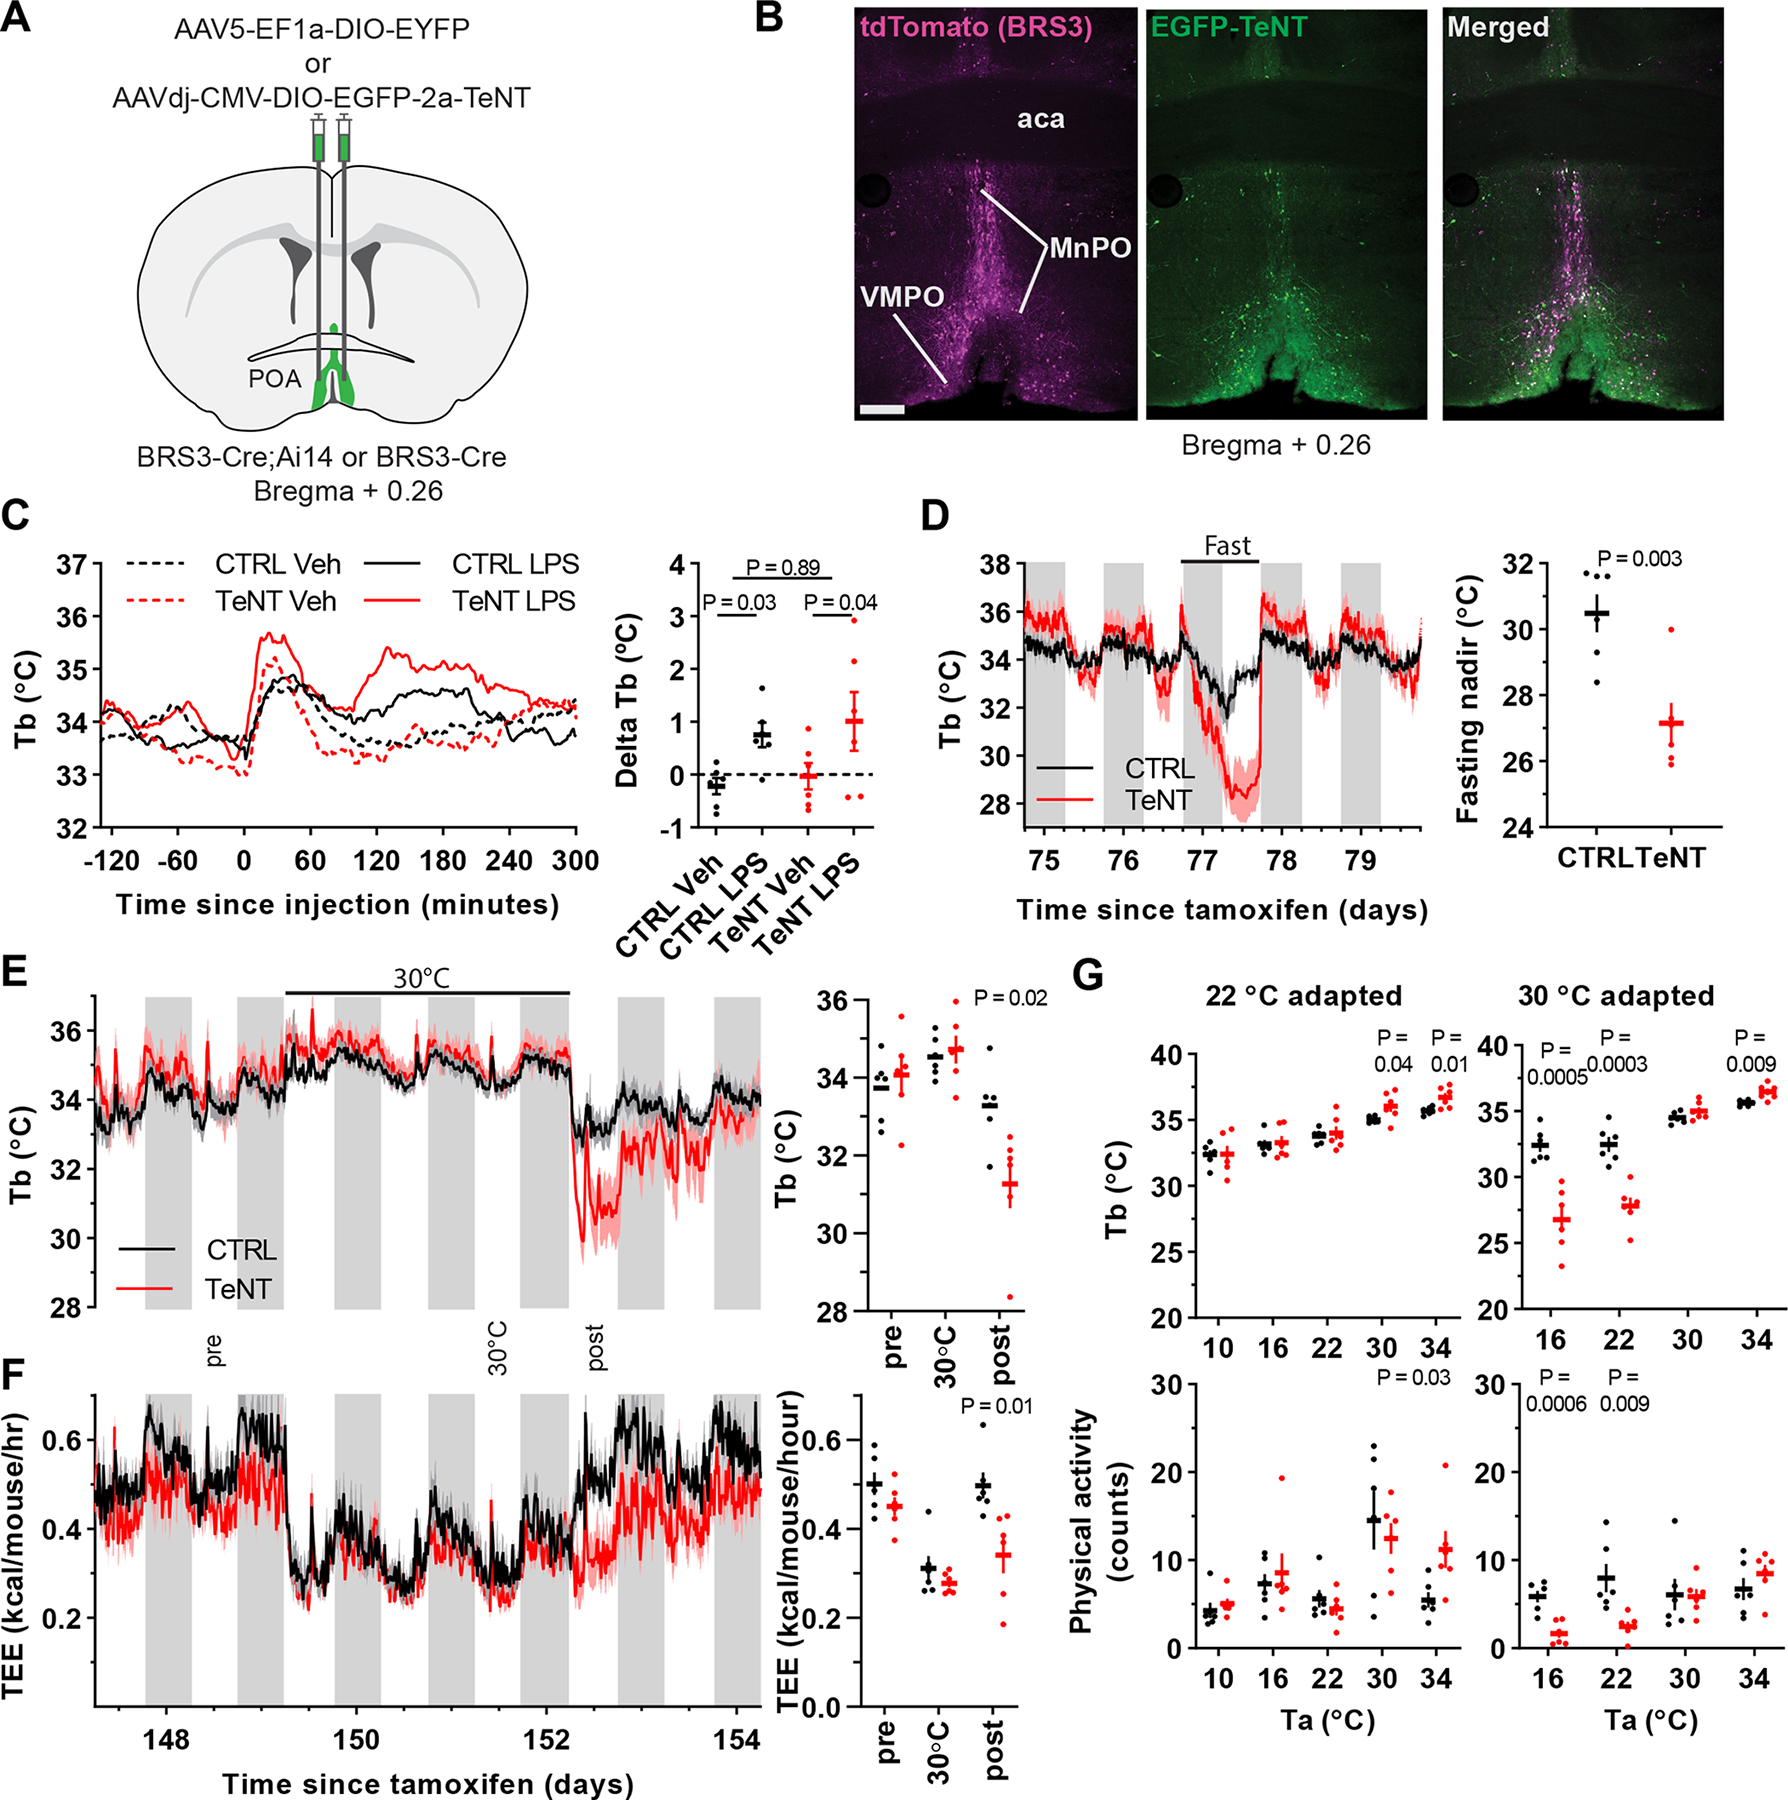
Figure 7.

Silencing POABRS3 neurons increases Tb variability and exaggerates Tb changes. a) Schematic of virus injection into the POA of BRS3-Cre mice (control, AAV-DIO-EYFP; silencing, AAV-DIO-EGFP-TeNT). b) Images of a POABRS3;Ai14::TeNT mouse (BRS3, magenta; TeNT, green). aca – anterior commissure; MnPO – median preoptic area; VMPO – ventromedial preoptic area c) Tb response to lipopolysaccharide (LPS, 100 μg/kg, i.p.) or vehicle (saline) and ΔTb (Tb120to210 minus Tb-120to-30). Data are mean ± s.e.m. (s.e.m. omitted from left for visual clarity); P value, paired t test between vehicle and LPS and unpaired t test with unequal variance between delta Tb (LPS minus Veh) of CTRL and TeNT groups. d) Tb response to 24 h food deprivation and fasting Tb nadir (mean ± s.e.m). P value, unpaired t test. e,f) Tb and total energy expenditure (TEE) of mice at 22 °C, then 3 days at 30 °C, then 22 °C. Quantitation in right panels of the indicated light phase12-h intervals; P value, unpaired t test. g) Acute response to various Ta in mice acclimated to 22 °C (left) or 30 °C (right). After >5 day of acclimation, during light phase mice were exposed to 180 min of the indicated Ta. The mean Tb and physical activity at 60–180 min is shown. P value, unpaired t test. In all panels, n=6 mice/group. See also Figure S6.
