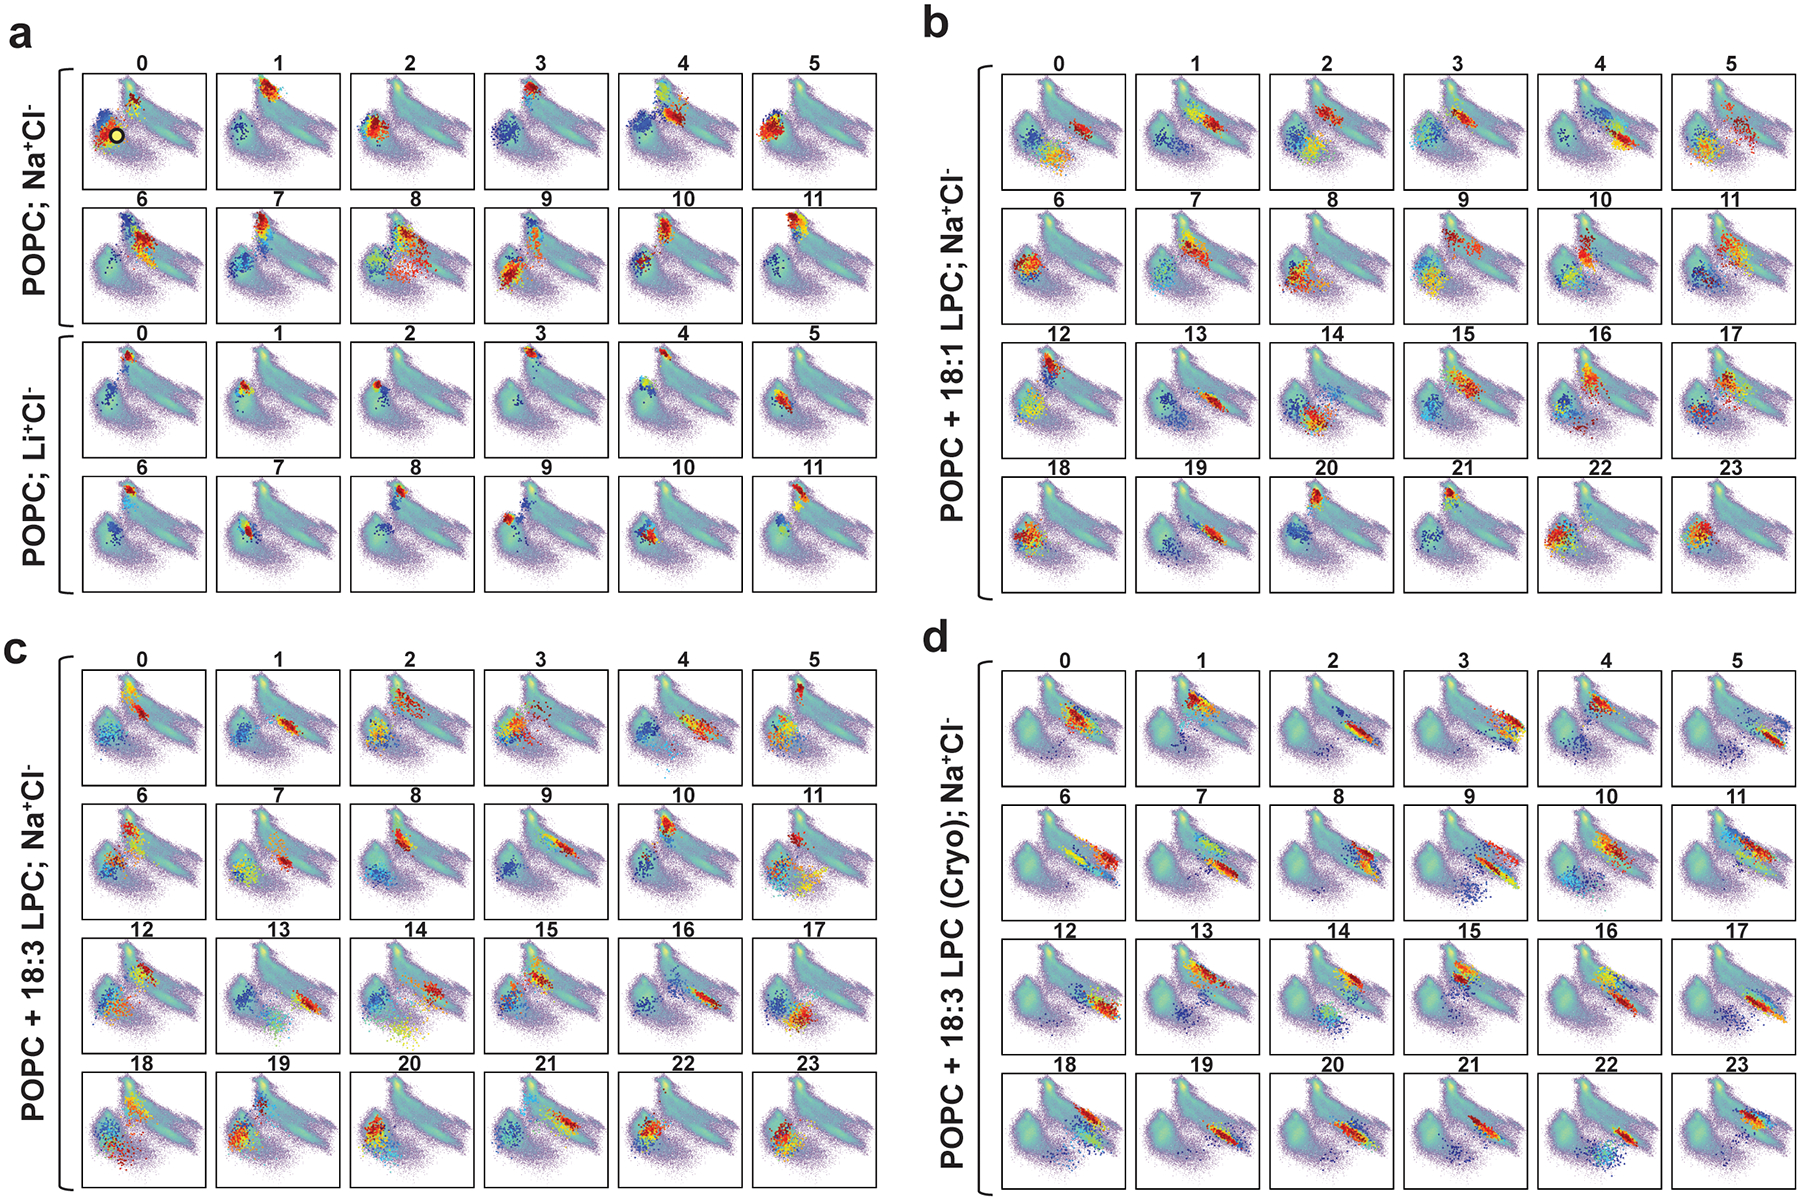
Extended Data Figure 9 |. Sampling of the major conformational states is affected by the presence and absence of Na+ and lysolipid substrate in the MD simulations.

Projection (coloured dots) of each MD trajectory from the 3 sets of simulations on the 2D tICA landscape (in pale colours) from Extended Data Fig. 7. Simulations of MFSD2A_GG in a POPC bilayer were performed in: a, either Na+Cl− or Li+Cl− solution; b, Na+Cl− solution with a single LPC-18:1 at the interface of the IC-gate and the inner leaflet of the membrane; c, Na+Cl− solution with a single LPC-18:3 at the interface of the IC-gate and the inner leaflet of the membrane; and d, Na+Cl− solution with a single LPC-18:3 bound as in the cryo-EM structure. The colours of the dots indicate the timeframes in the evolution of the trajectory: darker colours (blue, cyan) represent the initial stages of the simulation, lighter colours (yellow, green) correspond to the middle part of the trajectory, and reds show the last third of the trajectory. The yellow circle in panel a (trajectory 0) denotes the conformation of the system in which LPC-18:1, LPC-18:3 and LPC-DHA were introduced.
