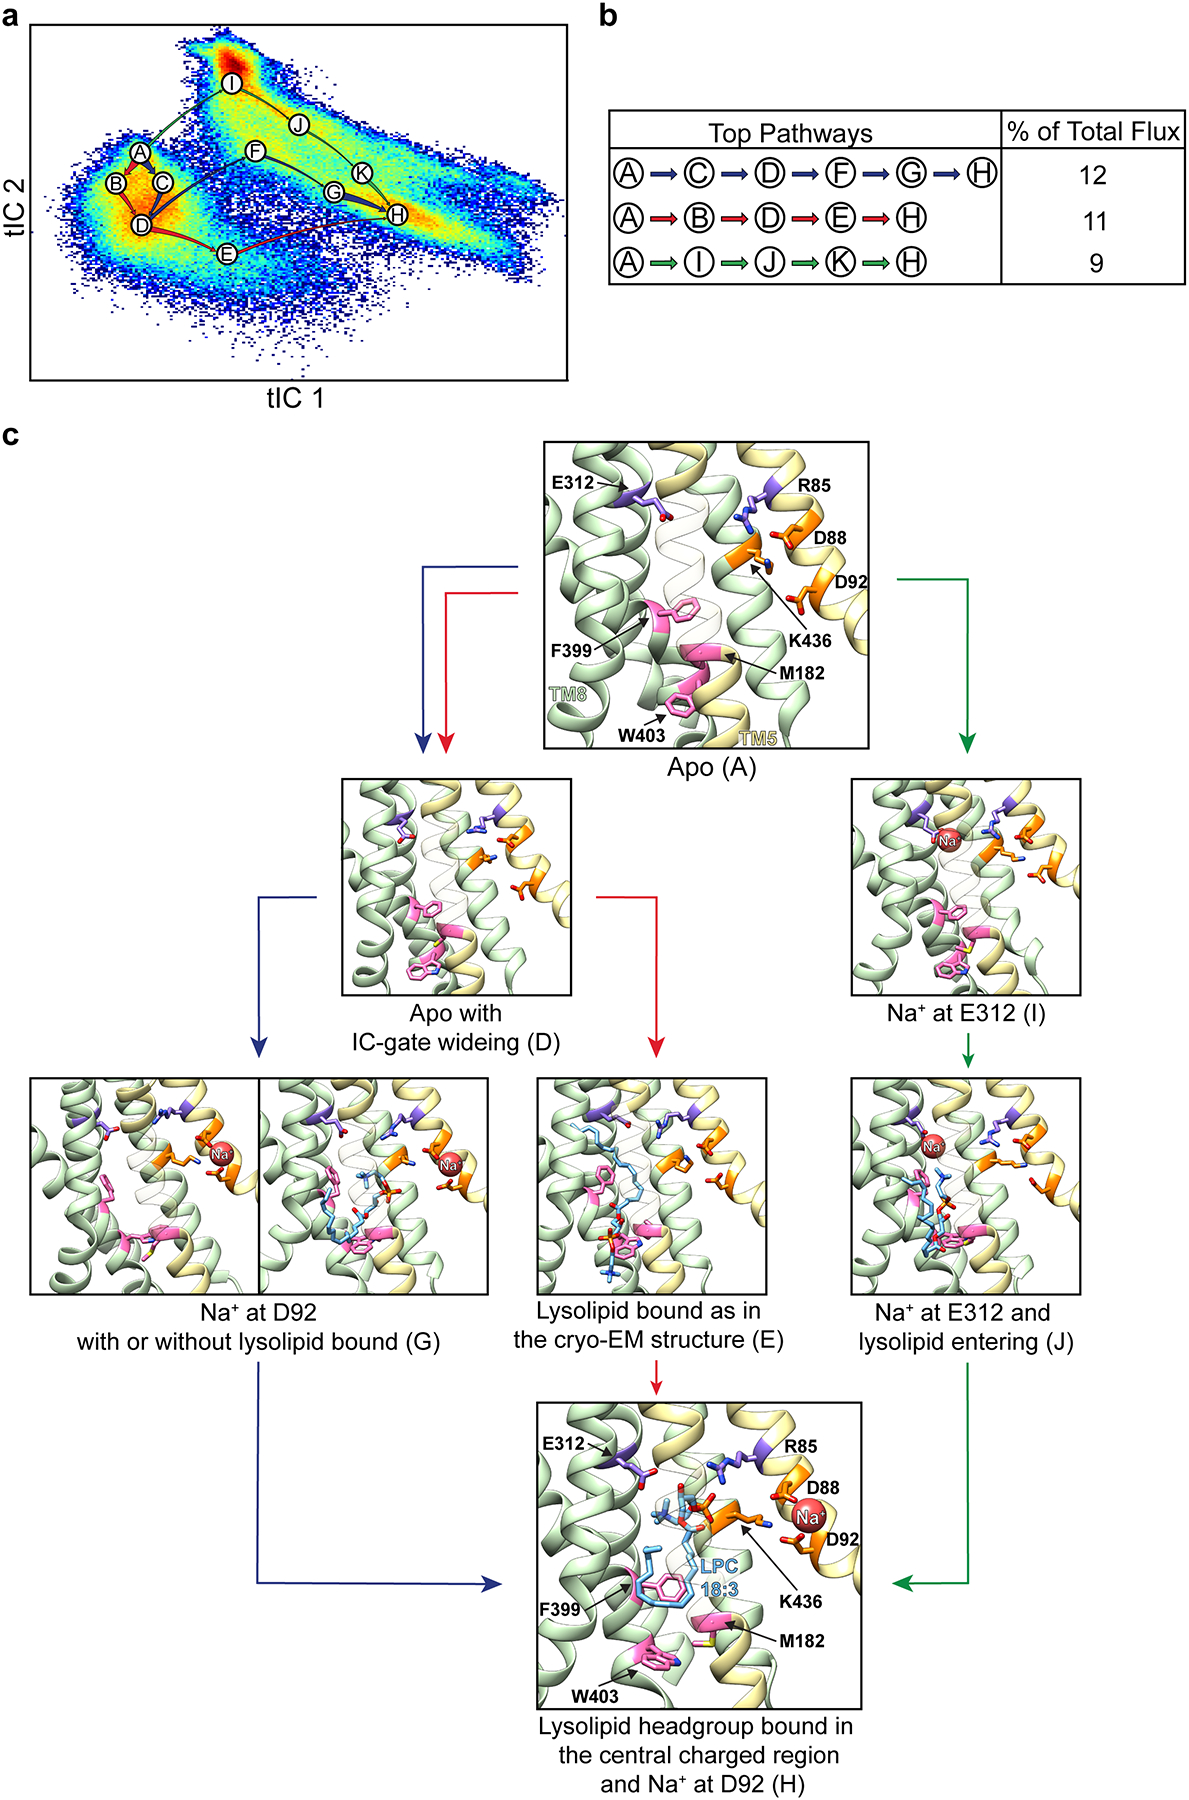
Extended Data Figure 10 |. Pathways for opening of the IC-gate and substrate entry.

a, The three main pathways for IC-gate opening and substrate penetration, identified from Markov State Modeling (MSM) and Transition Path Theory (TPT) analyses are shown on the tIC1 vs tIC2 landscape, represented as in Extended Data Fig. 7. Macrostates on these pathways are named A through H with each label placed at the center of the corresponding state. Arrows coloured in blue, red, and green represent the three main pathways between macrostates, and their thickness indicates the relative magnitude of flux for each given pathway. Macrostates A, I, G, and H correspond to states i, ii, iii, and iv in Fig. 3, and macrostate E corresponds to the cryo-EM structure. The remaining macrostates represent structural intermediates between these major states. b, The percentage of total flux for the top three pathways shown in panel a. c, Structural representation of the key macrostates from panel a. Macrostates B, C, F, and K have been omitted for simplicity, as they are structural intermediates between the major states presented (see Extended Data Fig. 7). Helices in the N-domain are coloured in yellow whereas those in the C domain are green. Select residues are shown in stick representation and coloured as in Fig. 2. For visual clarity, TMs 1, 3, 4, 6, 9, 12 have been omitted and TM5 is partially transparent.
