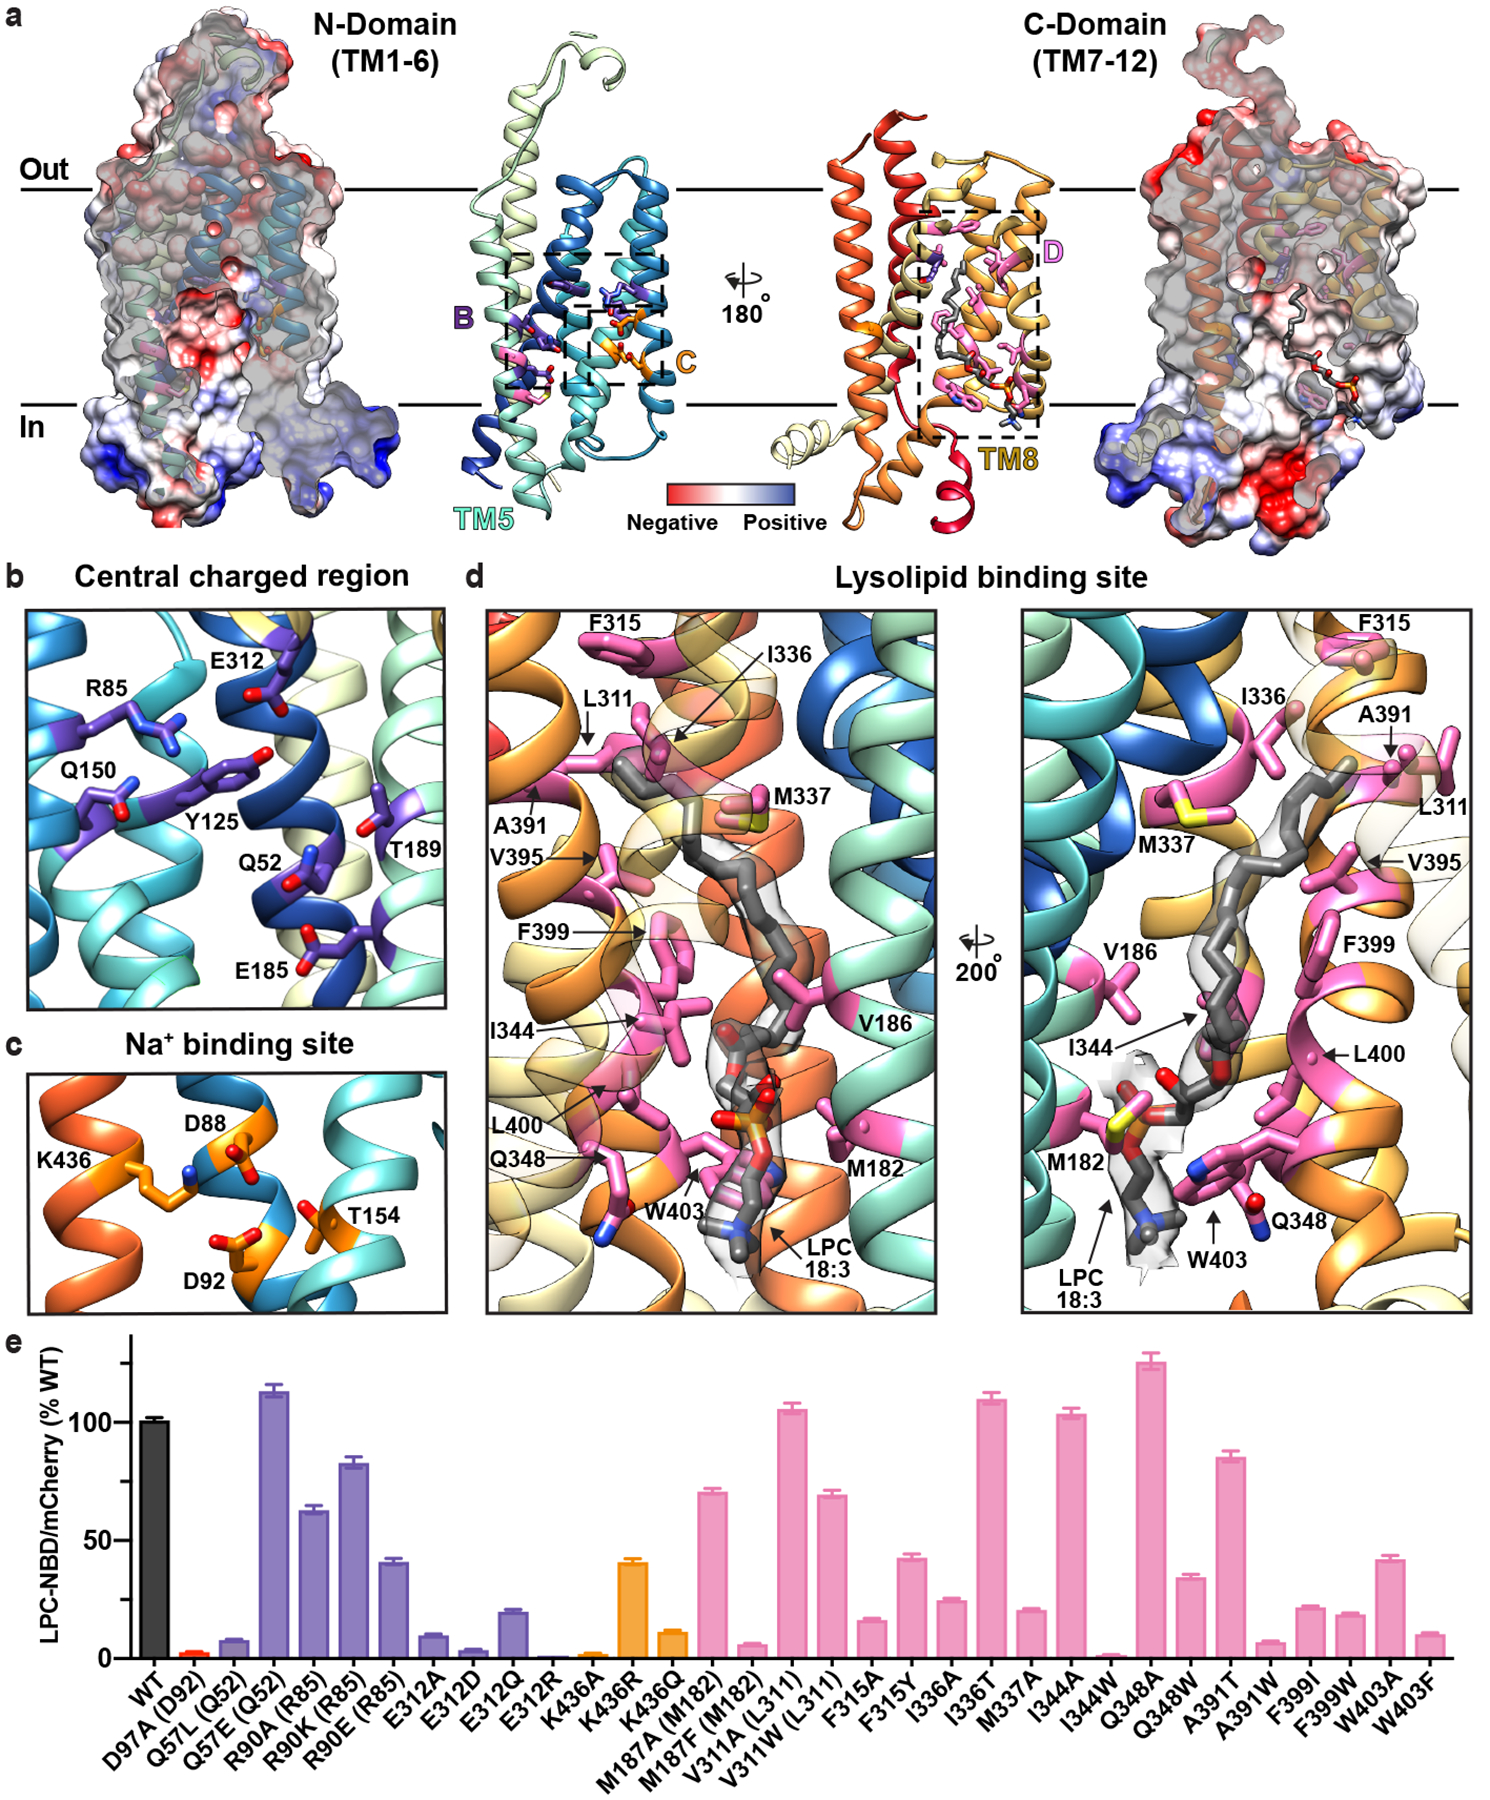
Figure 2 |. The intracellular cavity of MFSD2A features the Na+- and lysolipid-binding sites.

a, The N- (left) and C- (right) domains as viewed from within the intracellular cavity of MFSD2A_GG. For both domains, the electrostatic potential (from negative in red, to positive in blue) is shown as a surface, with the structure in ribbon representation (coloured as in Fig. 1) overlaid, and next to it. Insets refer to regions highlighted in panels b-d, with residues of interest and bound substrate (LPC-18:3) shown in stick representation. b, Central charged region with residues labelled and coloured in purple. c, Na+-binding site with residues labelled and coloured in orange. d, Lysolipid-binding site shown from two views with residues labelled and coloured in pink and bound LPC-18:3 in gray stick representation. The cryo-EM density assigned to bound lysolipid is displayed as a semi-transparent grey surface. For visual clarity, TM8 in the left panel is shown with partial transparency, and in the right panel TM2 and TM11 have been omitted and TM7 is partially transparent. e, Single-cell uptake of the fluorescent substrate LPC-NBD by cells expressing WT and mutant MFSD2A_HS-mCherry fusion constructs analysed by fluorescence-activated cell sorting. LPC-NBD uptake was normalized to mCherry expression and represented as a % of WT collected in the same experiment ± S.E.M. See Extended Data Fig. 6 for raw data and n values for each construct assayed. Colour coding matches that in panels a-d. Where residue number or identity differ between MFSD2A_HS and MFSD2A_GG the corresponding residue in MFSD2A_GG is also provided in parenthesis.
