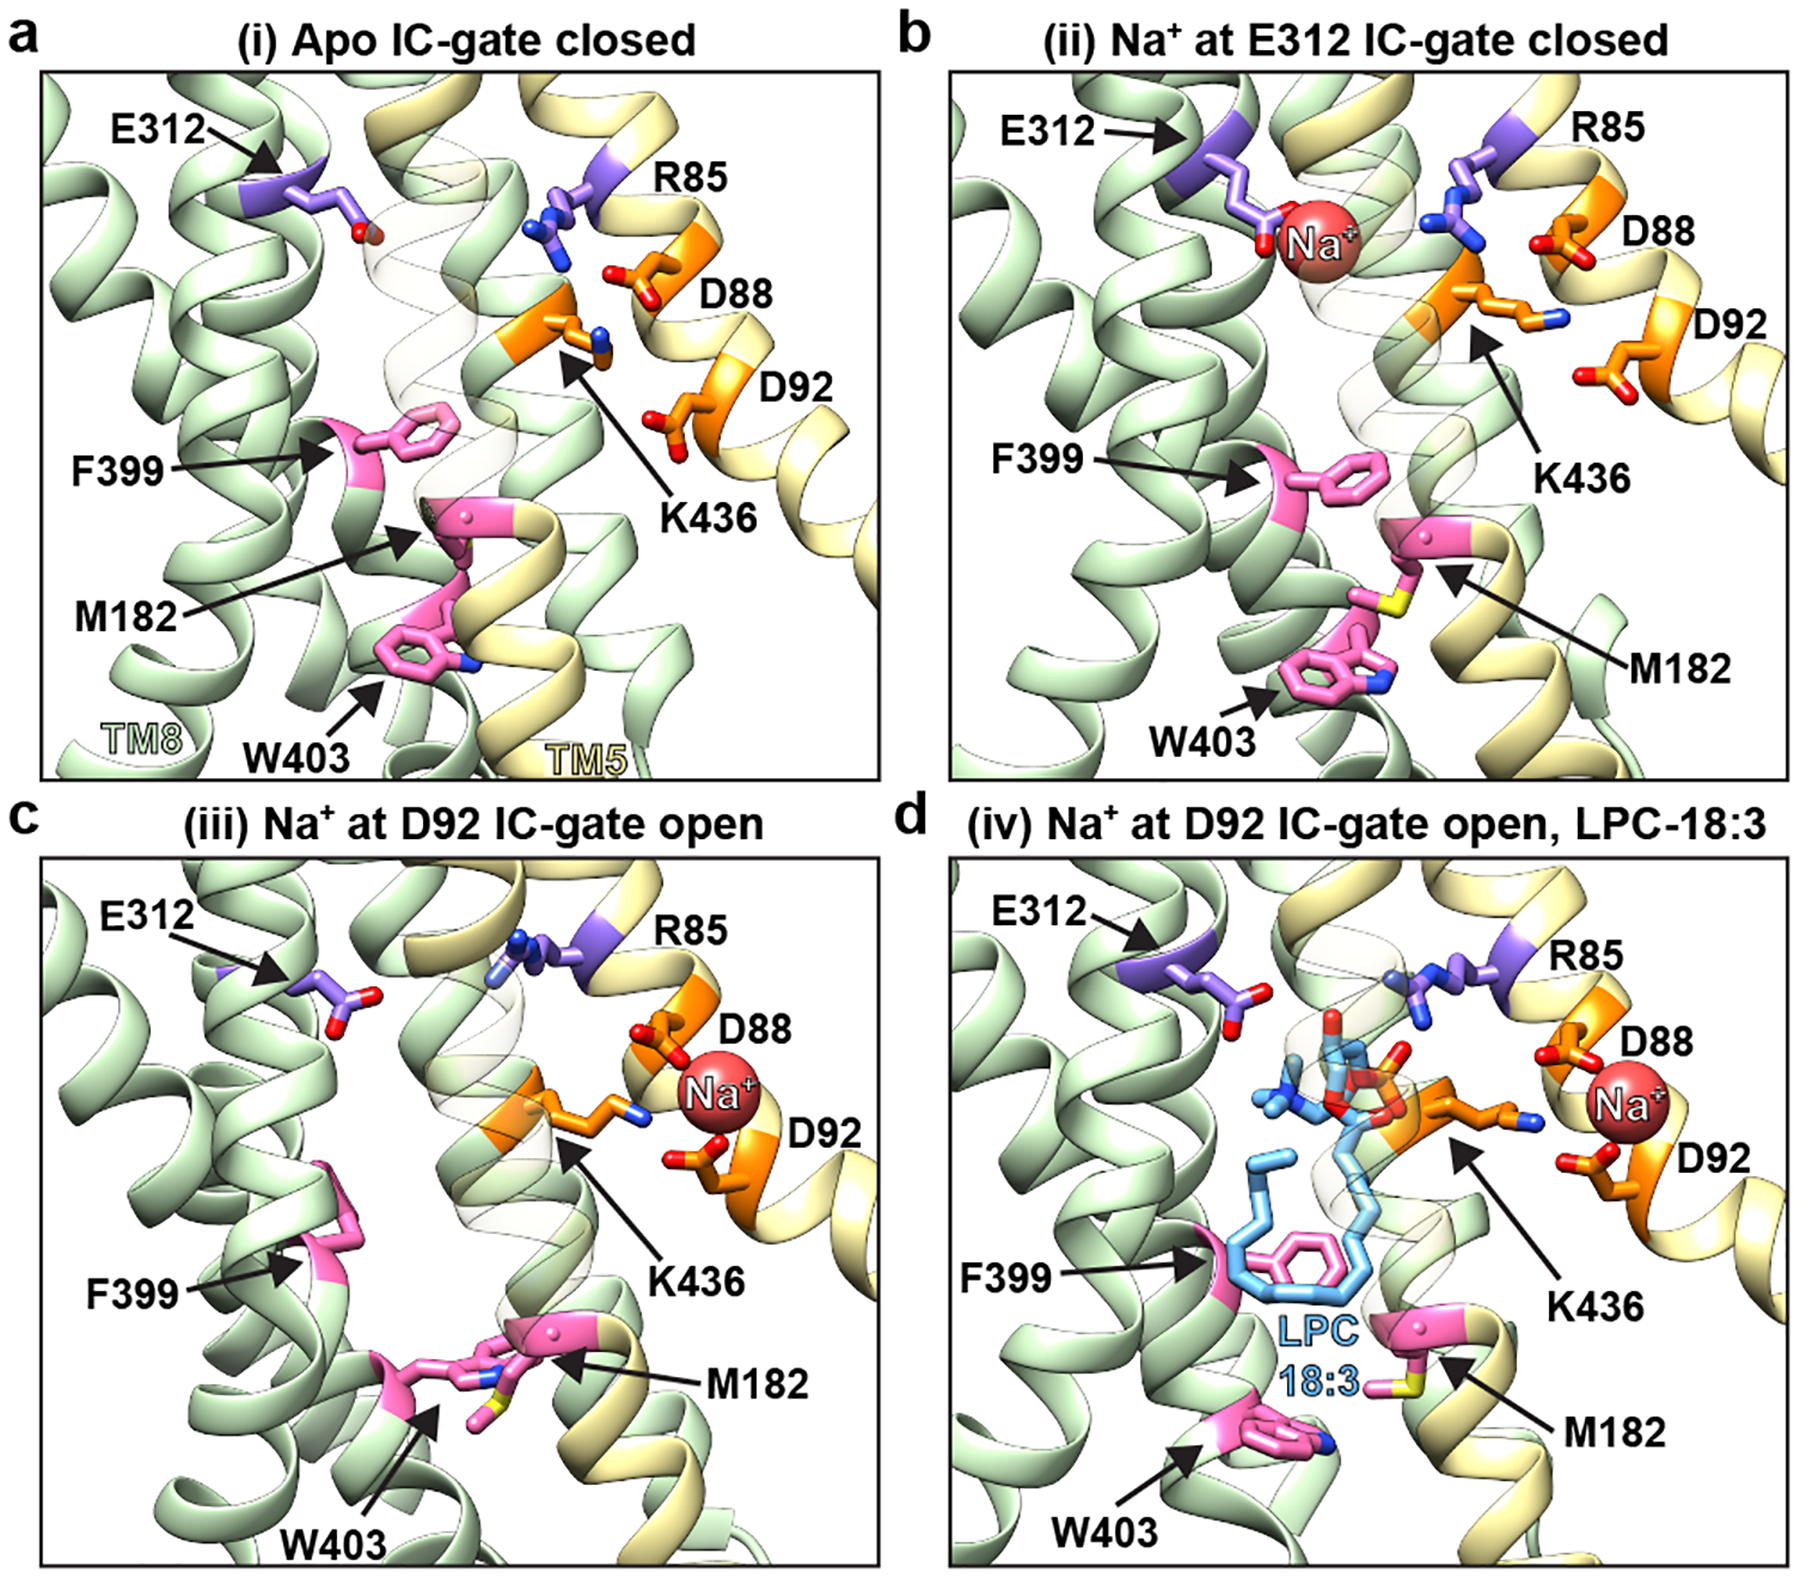
Figure 3 |. MD simulations of MFSD2A reveal coupling between Na+ binding and lysolipid movement through a dynamic intracellular gate.

Structural representation of conformational states in a, an apo conformation with the intracellular (IC) gate closed (i); b, Na+ at E312 and IC-gate closed (ii); c, Na+ at D92 and IC-gate open (iii); d, Na+ at D92, bound LPC-18:3 and IC-gate open (iv). Helices in the N-domain are coloured in yellow whereas those in the C domain are green. Select residues are shown in stick representation and coloured as in Fig. 2. For visual clarity, TMs 1, 3, 4, 6, 9, 12 have been omitted and TM5 is partially transparent. For corresponding microstate and histograms of selected collective variables (CVs) in the ensembles see Extended Data Fig. 7d, f.
