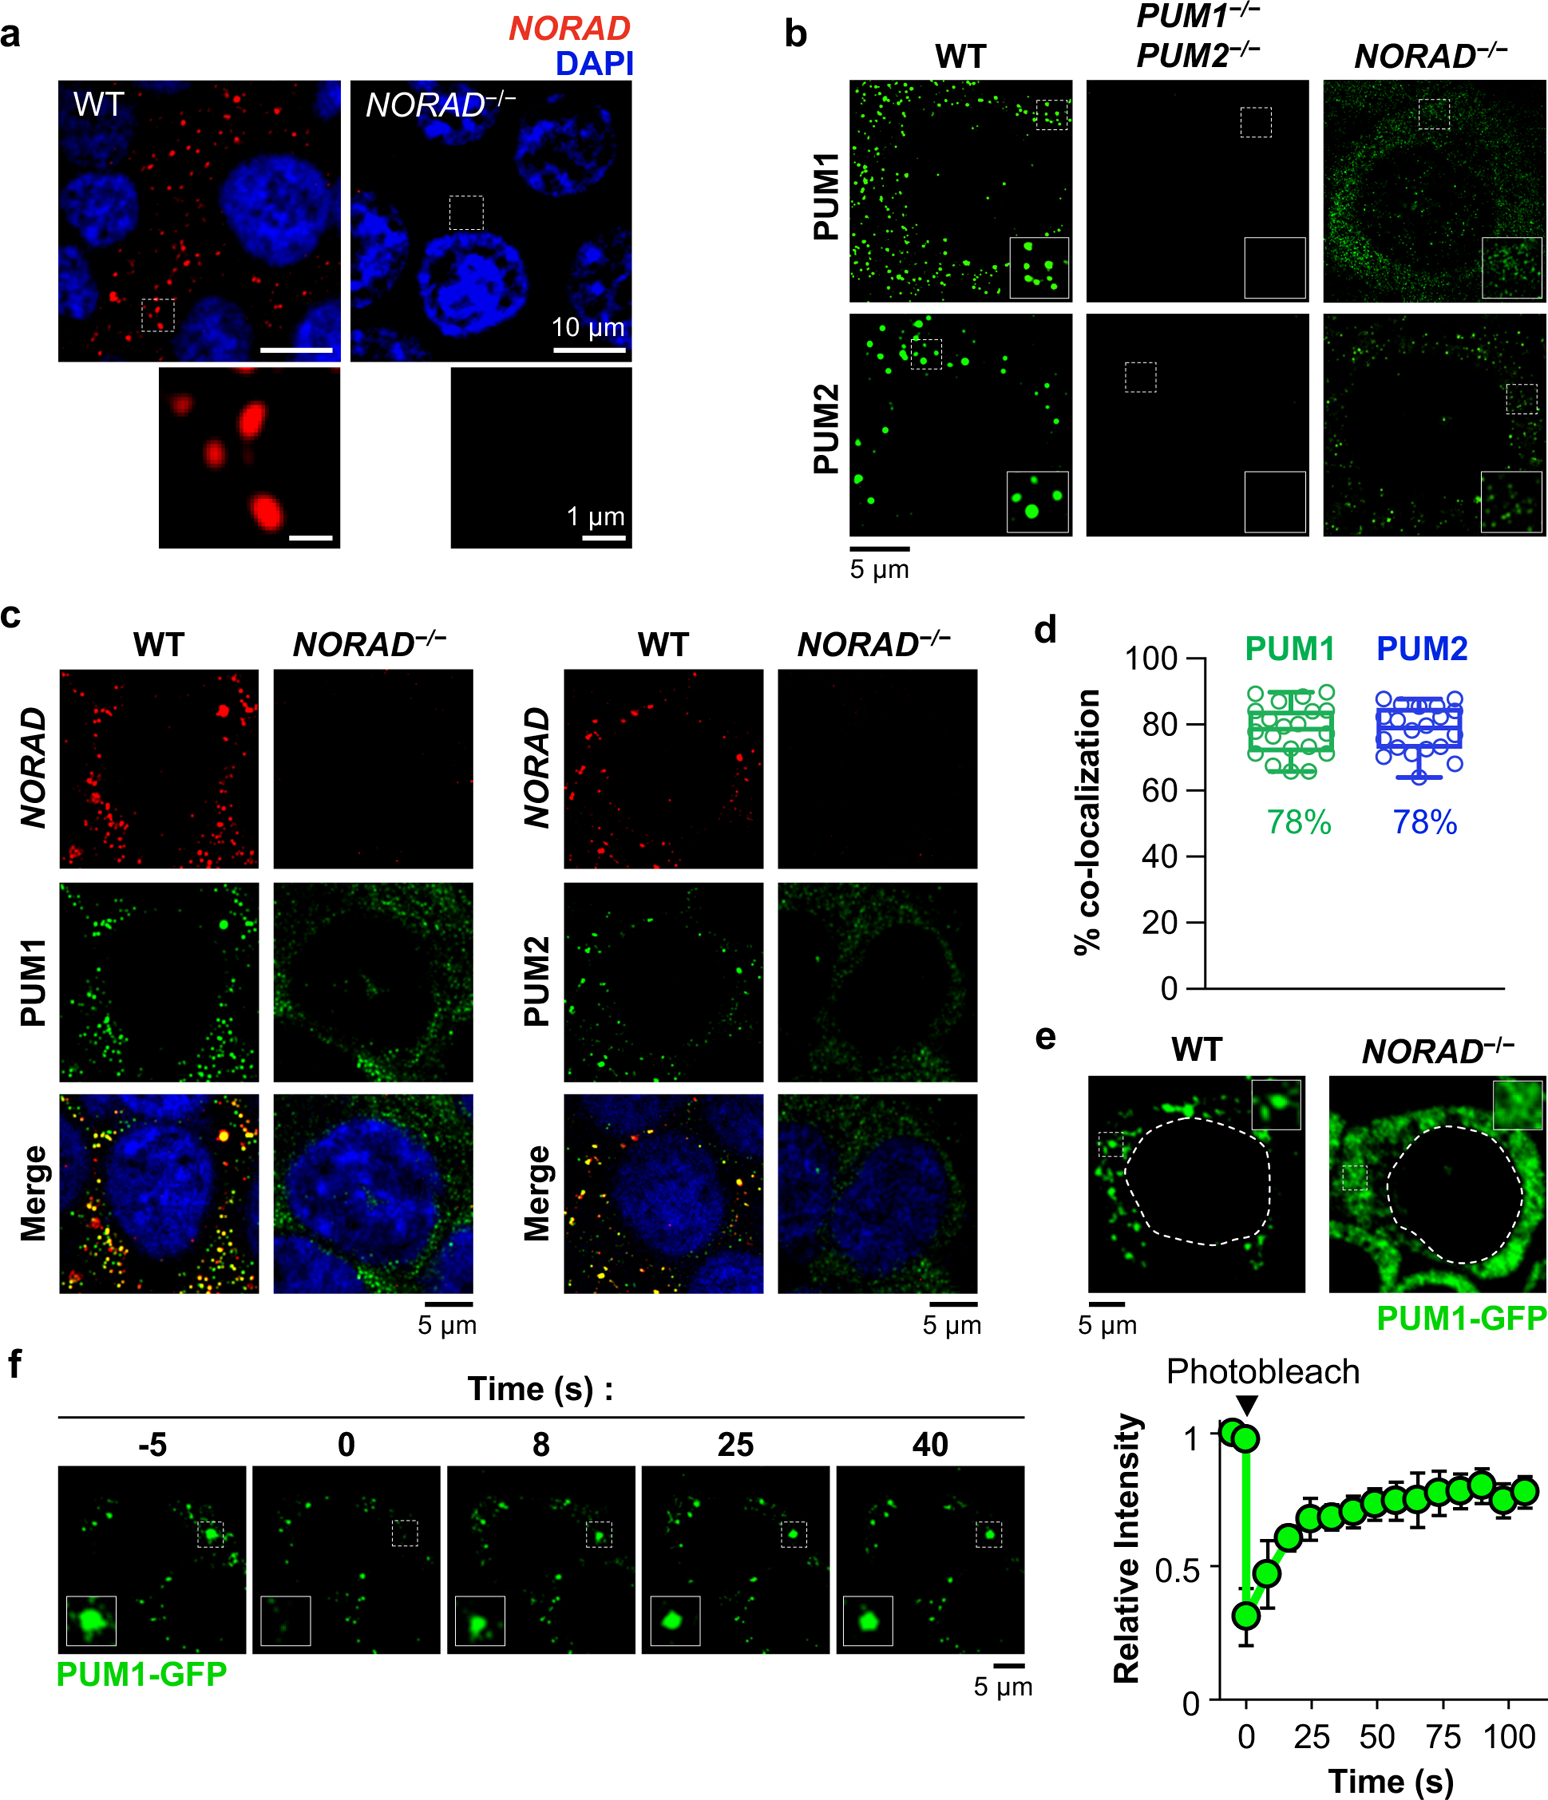
Fig. 1 |. NORAD and PUM co-localize in cytoplasmic foci.

a, Confocal images of NORAD RNA FISH in HCT116 cells. b, PUM immunofluorescence in HCT116 cells of the indicated genotypes, imaged with structured illumination microscopy (SIM). c, SIM images of NORAD and PUM co-stained cells. d, Quantification of NORAD and PUM co-localization (n = 20 cells for each PUM protein). Mean co-localization shown below box plots. Boxes extend from 25th to 75th percentiles; middle line represents median; whiskers extend from minima to maxima. e, Live cell confocal images of endogenous PUM1-GFP. Dashed lines indicate nuclear boundaries. f, Images (left) and quantification (right) of PUM1-GFP FRAP. Fluorescence intensities plotted relative to pre-bleach time point (t = −5 s). Data shown as mean ± SD (n = 3 droplets).
