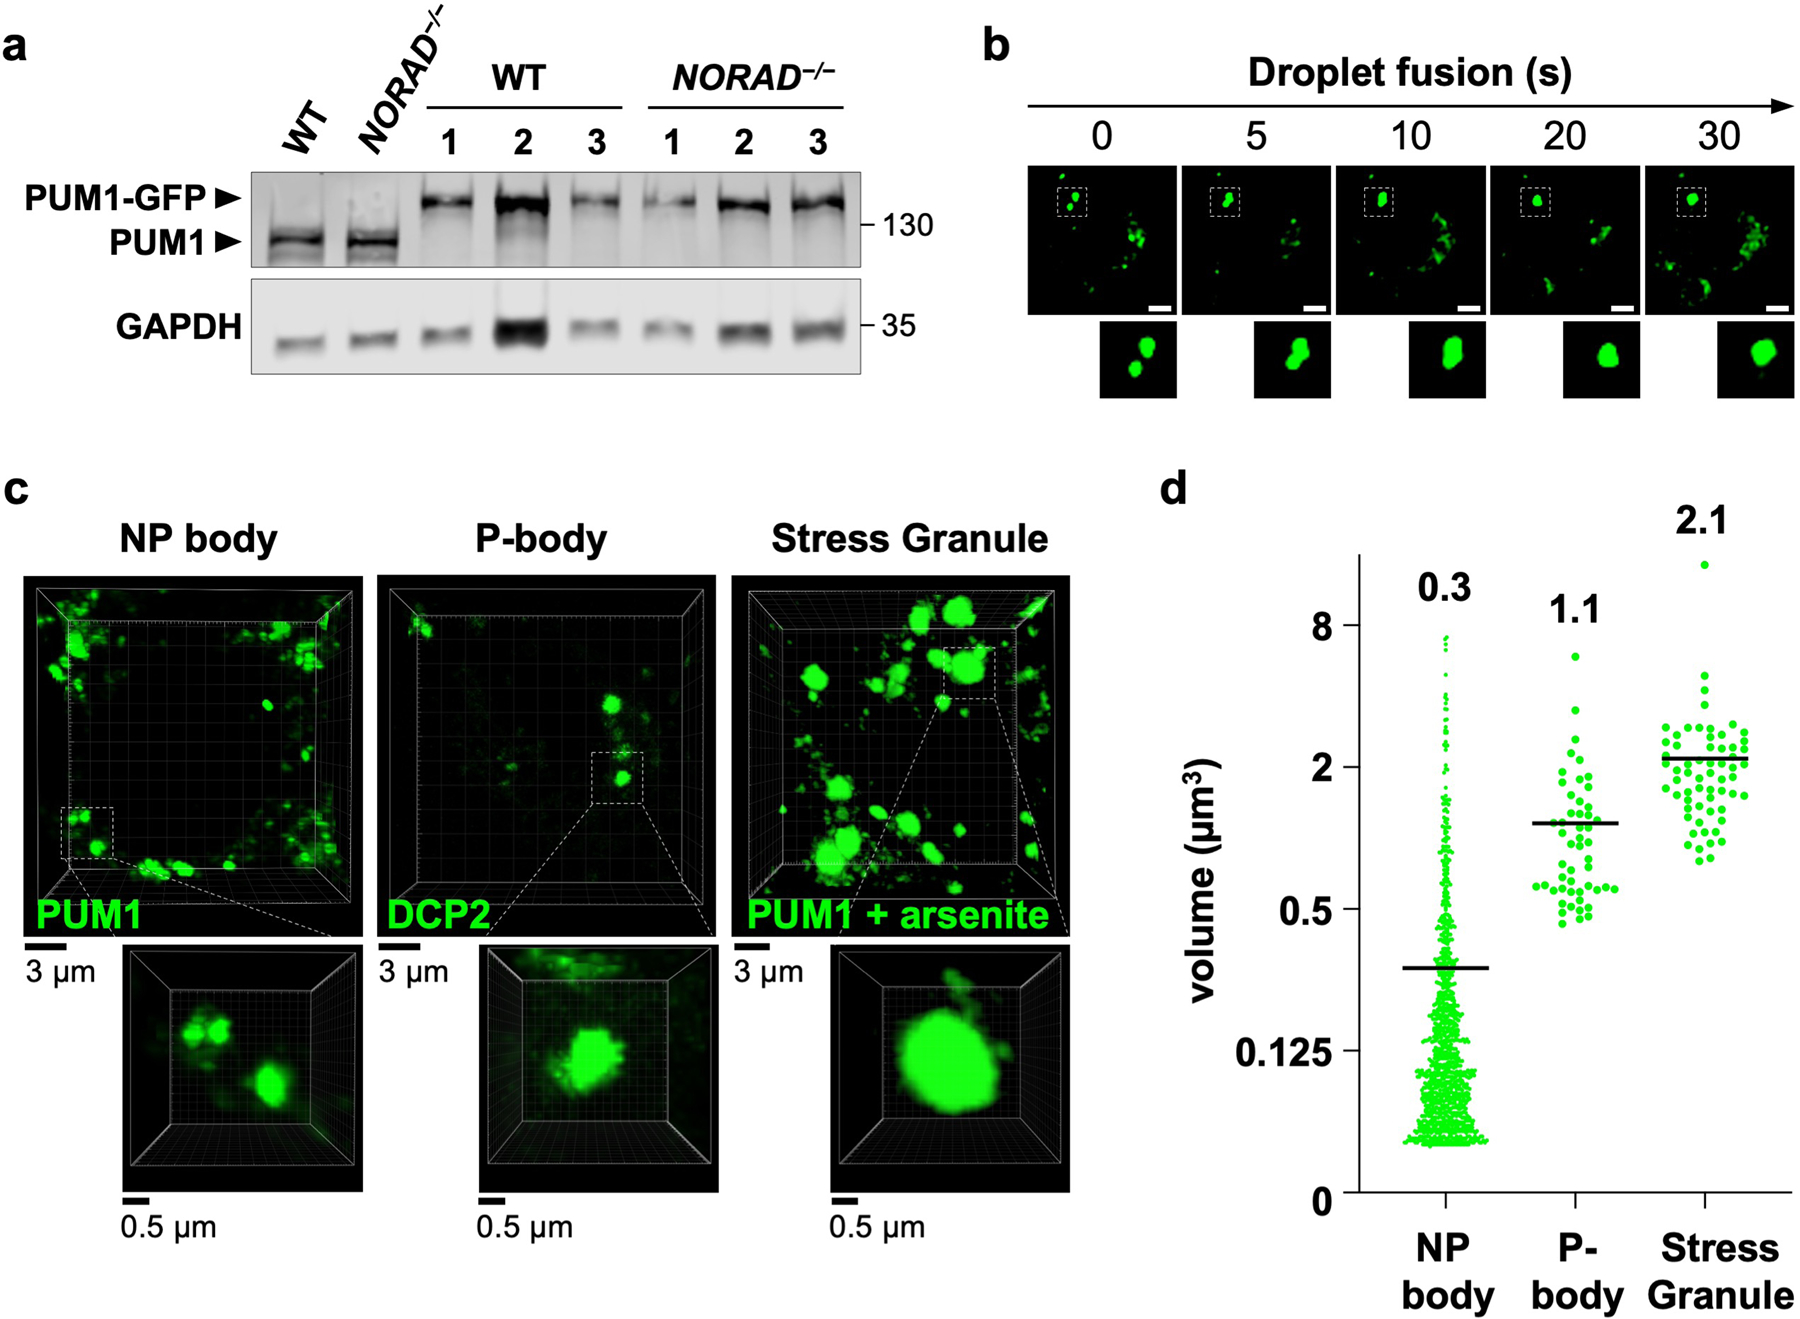
Extended Data Fig. 2 |. NP bodies are liquid-like condensates distinct from other known cytoplasmic granules.

a, PUM1 western blot in HCT116 clones with GFP knock-in at the endogenous PUM1 locus. Three genotype-confirmed wild-type and NORAD−/− clones shown alongside parental wild-type and NORAD−/− cells. Molecular weight in kDa shown on right of blots. For gel source data, see Supplementary Figure 1. b, Time-lapse images showing fusion of endogenous PUM1-GFP condensates in HCT116 cells. Scale bar, 5 μm. c, Representative 3D-reconstructed live cell confocal images used to estimate the volume of NP bodies, P-bodies, and stress granules. Endogenously-tagged PUM1-GFP HCT116 cells were used for NP body or stress granule measurements (the latter after treatment with 0.5 mM sodium arsenite for 1 hour). P-body marker DCP2-GFP was used to estimate the volume of P-bodies in HCT116 cells. d, Quantification of condensate volumes (n = 1072 NP bodies from 20 cells, 51 P-bodies from 11 cells, and 62 stress granules from 10 cells). Average volume of each granule shown above plots.
