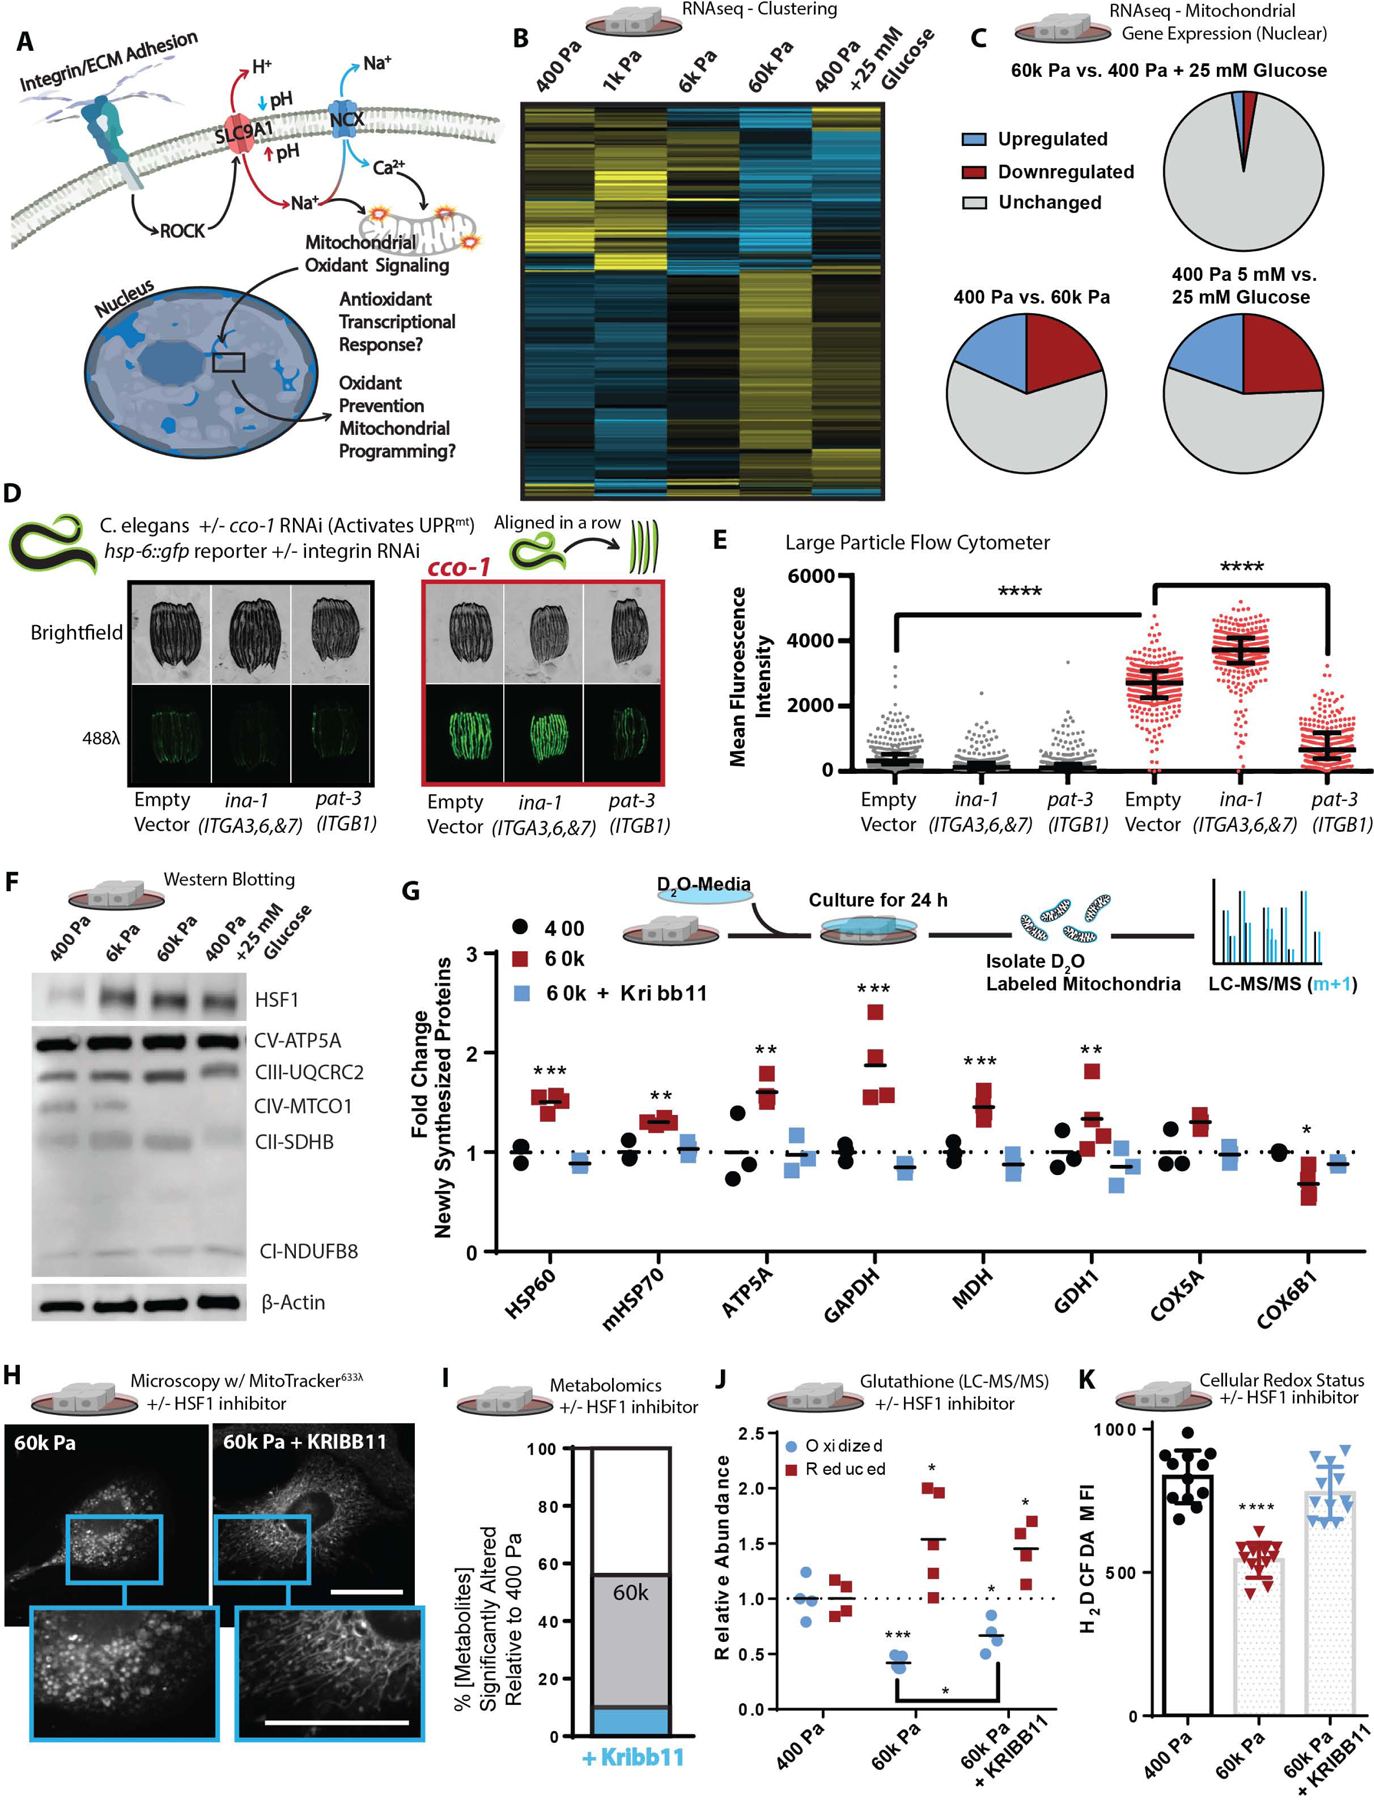
Figure 4: Mechanosignaling facilitates mitochondrial stress response via HSF1.

A. Graphical representation of the paradigm and remaining questions.
B. Heatmap depicting unsupervised hierarchical clustering of RNAseq of cells cultured on soft-to-stiff ECM for 24 h +/− glucose [5 or 25 mM], (n=2 duplicate libraries of 3 biological replicates, ~ 10 million reads per library).
C. Comparison of significantly altered MitoCarta 2.0 catalogued genes from the 400 pa, 60k, and 400 pa + 25 mM glucose conditions shown in Figure 4B.
D.hsp-6::gfp reporter fluorescent intensity representative images of C. elegans quantified, in Figure 4E RNAis were mixed at a 5:1 ratio of ev, ina-1, or pat-3 RNAi to ev or cco-1 RNAi as depicted (hsp-6 is the HSPA9/mtHSP70 orthologue)
E. Quantification of hsp-6::gfp reporter fluorescent intensity of C.elegans measured with a large particle cytometer, +/− cco-1 RNAi (n=387, 309, 377, 326, 312, and 294 animals in order left to right, repeated 3 times).
F. Western blot depicting relative protein abundance of HSF1, electron transport chain components, or β-actin within 5 μg of total protein derived from lysates of cells cultured on soft-to-stiff ECM for 24 h +/− glucose [5 or 25 mM].
G. Stable Isotope mitochondrial proteomics of crude mitochondrial fraction of MCF10A cells grown 400 or 60k Pa ECM for 24 h +/− KRIBB11 [2 μM] [(n=4 biological replicates LC-MS run together, repeated 2 times)
H. Confocal microscopy of 100 nM mitotracker (deep red FM) stained and fixed (PFA) cells cultured on 60k Pa ECM surfaces for 24 h +/− vehicle or KRIBB11 [2 μM]. MitoMAPR Quantification: 60k (7) and 60k + Kribb11 (12) junctions per network.
I. Metabolomics (LC-MS) of cells cultured on 400 or 60k Pa ECM for 24 h, % significantly altered relative to 400 Pa +/− KRIBB11 [2 μM]. (n=4–5 biological replicates LC-MS/MS run together, repeated 2 times)
J. Oxidized/reduced glutathione (NEM protected) measurements of MCF10A cells grown on 400 or 60k Pa ECM for 24 h +/− KRIBB11 [2 μM] [(n=4 biological replicates, repeated 2 times) (n=4–5 biological replicates LC-MS run together, repeated 2 times).
K. Oxidative stress indicator intensity of cells after 1 hour, MCF10A cells cultured on varied 400 or 60k Pa ECM for 24 h +/− vehicle or KRIBB11 [2 μM] prior, measured with 2’,7’-dichlorodihydrofluorescein diacetate (H2DCFDA) [2 μM].
