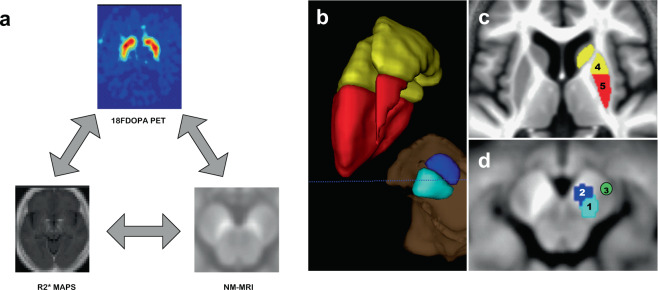
Fig. 1. Analyses design and definition of substantia nigra and striatum masks.
a Diagram showing the three types of relationship explored in this study, between NM-MRI, R2* maps, and F-DOPA PET scan. This diagram will be recalled beside every correlation studied. b Tridimensional view of left SN and striatum with their divisions. c Axial slice at the level of basal ganglia on the mean structural image of the whole population sample (PD + HC), showing striatum delineation. Precommissural striatum is depicted in yellow (4) and postcommissural striatum in red (5). This division is supported by anatomical and functional data20,87. d Axial slices at the level of midbrain on a NM-MRI, showing substantia nigra delineation, with division in lateral tiers (1, light blue) and medial tiers (2, dark blue), according to neuropathological data79. Cerebral peduncle is also delineated (3, green).

