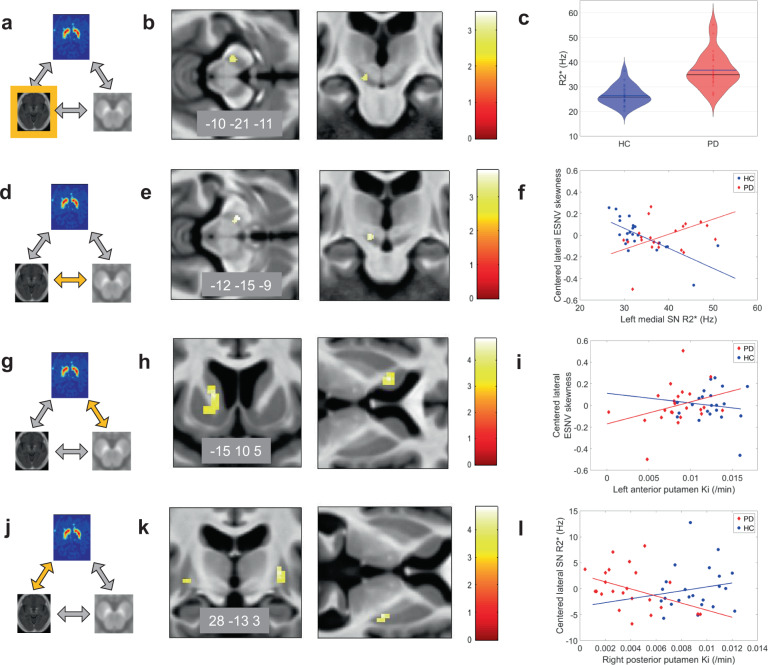
Fig. 4. Relationships between NM-sensitive MRI, R2*, and [18F]DOPA PET changes in Parkinson’s disease.
a–c R2* changes in Parkinson’s disease. Main effect of disease on brain iron, as assessed by R2*, displayed at p < 0.001 uncorrected over the mean structural image of the whole population. Color scales are proportional to t values. d–f Relationship between R2* and NM-sensitive MRI data. f Peak voxel ESNV skewness in both SN increases as R2* increases in left SN, significantly more in PD patients than HC. g–i Relationship between dopaminergic neurotransmission ([18F]DOPA PET) and NM-sensitive MRI data. Regression between peak voxel in left anterior putamen Ki and bilateral SN ESNV skewness. j–l Relationship between dopaminergic neurotransmission ([18F]DOPA PET) and R2*. Peak voxel Ki values in posterior putamen regressed differentially in PD and HC with lateral SN R2*. All results are displayed at p < 0.001 uncorrected over the mean structural image of the whole population. Color scales are proportional to t values.

