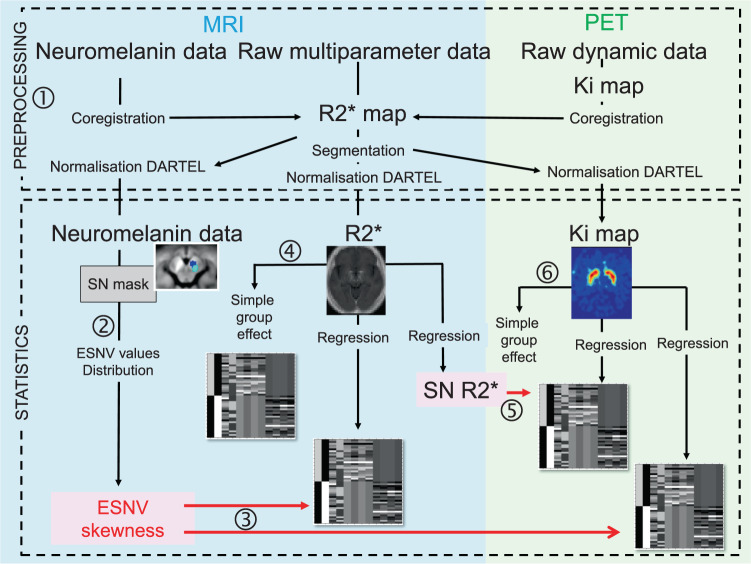
Fig. 6. Chartflow of data processing and analyses (see text).
1. Preprocessing ensures that MRI and PET data are finally registered in a common space. 2. Neuromelanin data consist of ESNV across all SN voxels, corrected for baseline values taken from bilateral cruces. 3. ESNV skewness act as regressor for R2* and Ki maps. 4. R2* maps serve in a group comparison. 5. R2* values in SN serve as regressor for Ki maps. 6. Ki map are used to show the voxelwise group effect. The gray diagrams illustrate design matrices.

