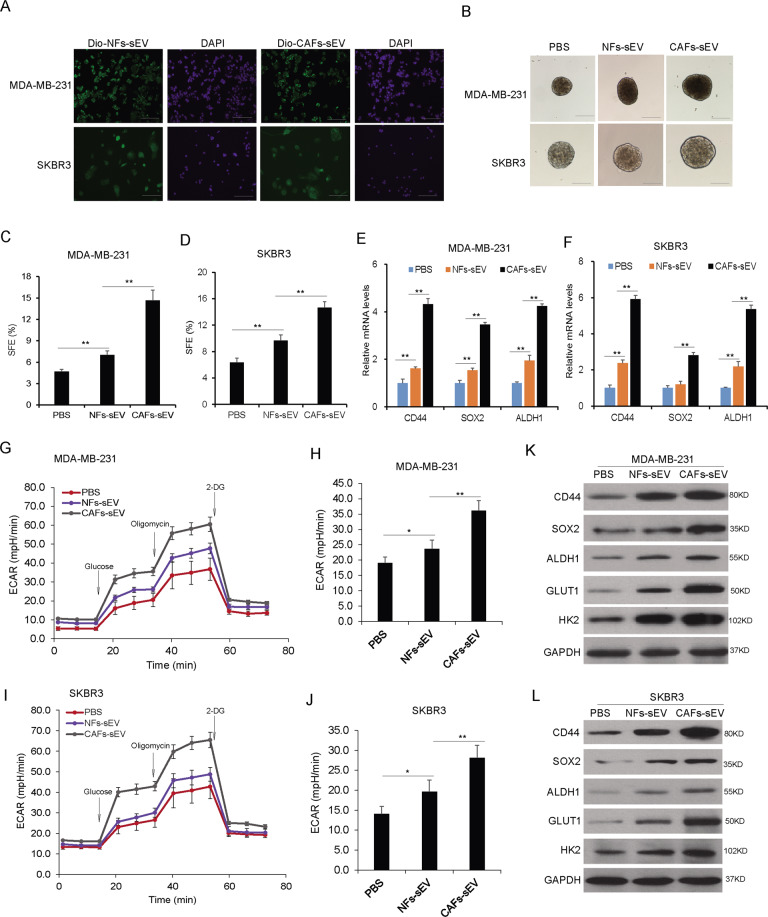
Fig. 2. The sEVs from CAFs increased the population of breast cancer stem cells and glycolysis.
A MDA-MB-231 cells could uptake sEVs from CAFs or NFs. sEVs were labeled with Dio and co-cultured with the cells for 6 h and sEVs were observed under a microscope (scale bars, 100 µm). B CAFs derived sEVs increased the population of breast cancer stem cells. MDA-MB-231 and SKBR3 cells were treated with CAFs-sEV or NFs-sEV for sphere formation analysis and the spheres were observed under a microscope (scale bars, 100 µm). C, D Sphere formation rates of MDA-MB-231 and SKBR3 cells. E, F The expression of stem cell markers in MDA-MB-231 and SKBR3 cells. The total RNA was extracted from the mammospheres from breast cancer cells. The markers such as CD44, CD24, and ALDH1 were assayed by real-time RT-PCR. G Extracellular cellular acid rate (ECAR) in cancer with CAFs-sEV or NFs-sEV treatment. ECAR was measured by the Seahorse XF Cell Mito Stress Test in MDA-MB-231 cells. Measurements were performed in triplicates. H Glycolysis and glycolytic capacity analysis from (G). I ECAR in cancer with CAFs-sEV or NFs-sEV treatment. ECAR was measured by the Seahorse XF Cell Mito Stress Test in SKBR3 cells. Measurements were performed in triplicates. J Glycolysis and glycolytic capacity analysis from (I). K, L The expression of stem cell markers in breast cancer cells. MDA-MB-231 and SKBR3 cells were treated with CAFs-sEV or NFs-sEV for 48 h and total protein was extracted for western blot analysis. *p < 0.05, **p < 0.01.

