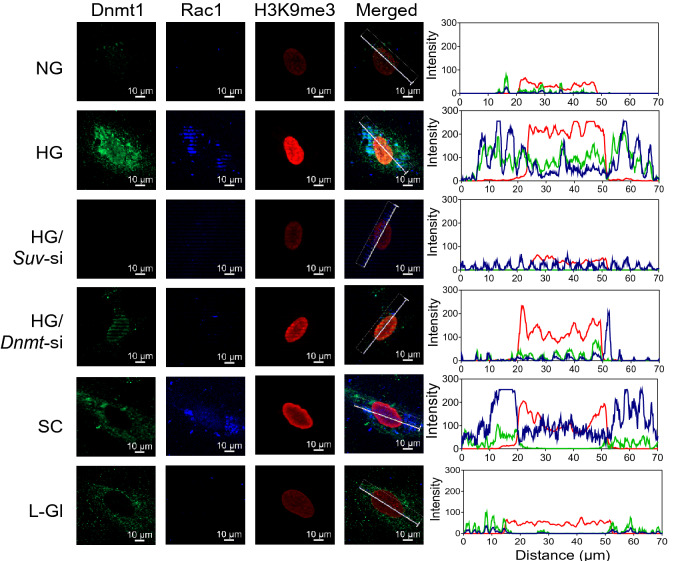
Figure 4.
Effect of high glucose on localization of H3K9me3, Dnmt1 and Rac1. Immunofluorescence technique was used to determine co-localization of H3K9me3, Dnmt1 and Rac1 in HRECs. The images were captured by Zeiss microscope at 40 × magnification using the Apotome module. The line represents the region of interest used to quantify the arithmetic mean intensity per channel. The figure shows one representative cell/condition. Colors green, blue and red represent Dnmt1, Rac1 and H3K9me3, respectively.

