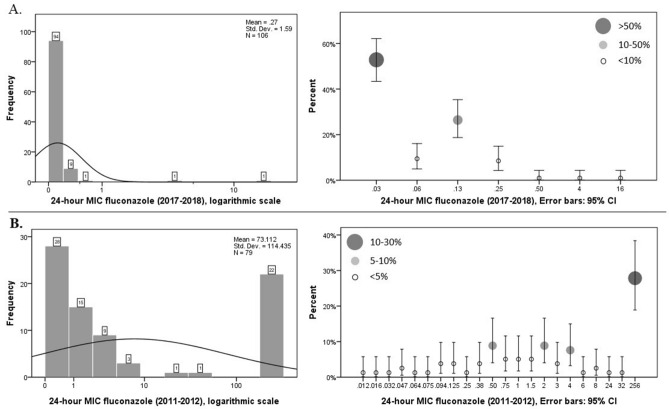
Figure 2.
24-h MIC fluconazole of 117 (2011–2012), and 106 (2017–2018) strains of C. albicans. (A) Illustrate chart bar (left) which each bar is labeled with the number of isolates and logarithmic scales (right) of 24-h MIC fluconazole during p2 (2017–2018) which Frequency of MIC results is presented in error bars with 95% CI. Each error bar is labeled by circles that are representative of MIC frequency. (B) Illustrate chart bar (left) and logarithmic scales (right) of 24-h MIC fluconazole during p1 (2011–2012). MIC distribution histogram also is provided for better comparison between the two periods.

