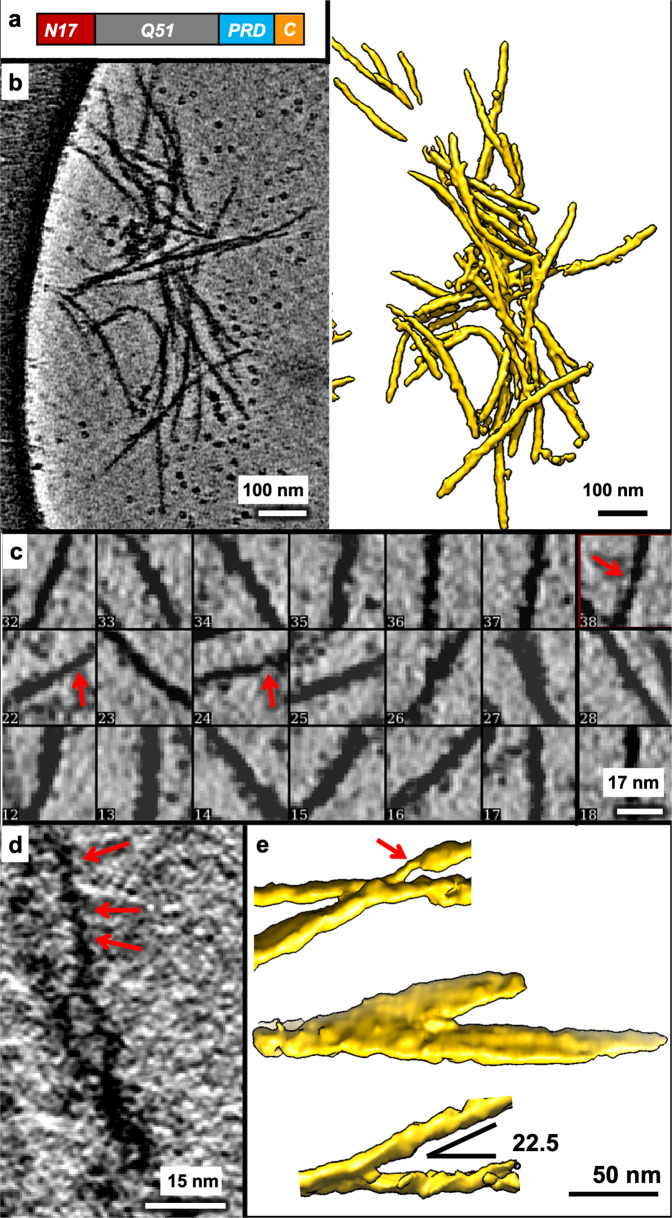
Fig. 1. MEx1-Q51 filaments exhibit a large variation in width within and across filaments.
a Schematic of the mEx1-Q51 construct. b Slice parallel to xy (~1.7 nm thick) through a representative 4x downsampled cryoET tomogram of aggregated mEx1-Q51, reconstructed with compressed sensing, lightly filtered to enhance visualization, and corresponding semi-automated 3D annotation. c Selected areas from slices of large mEx1-Q51 aggregates showing individual filament segments, widely varying in width, with the thinnest filaments exhibiting regions down to ~2 nm width, indicated by the red arrows. d Zoomed-in view of a xy slice (~0.4 nm thick) from a selected region of a tomogram without any downsampling, showcasing ultra-thin regions in mEx1-Q51 filaments. e Sections of annotated mEX1-Q51 filamentous aggregates from cryoET tomograms showing relatively narrow branching angles and an example of a thicker laminated sheet-like region (the annotation example in the middle). Scale bars: 100 nm (b), 17 nm (c), 15 nm (d), 50 nm (e).

