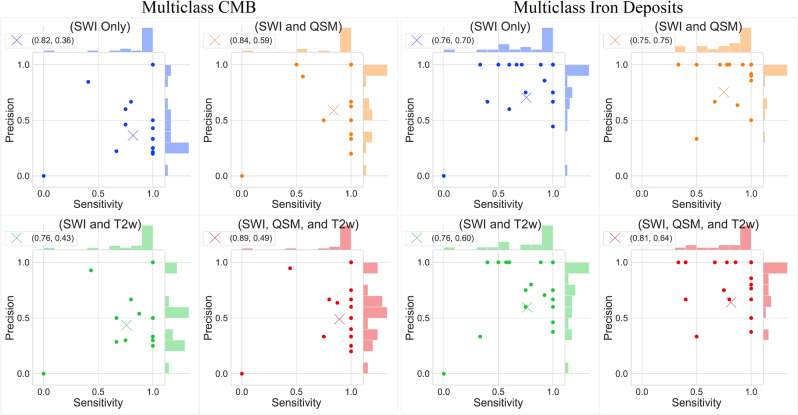
Figure 3.
Joint scatterplots of the sensitivity vs precision of all multiclass experiments predicting CMBs and non-hemorrhage iron deposits. (Left) all evaluations for CMBs and (Right) all evaluations for iron deposits. In each subplot, the round points indicate the individual participants’ sensitivity and precision evaluated with leave-one-out cross-validation, and the X indicates the mean sensitivity and precision. The legend at the upper left corner of each subplot shows the coordinates of X. In each subplot, histograms of the sensitivity and precision are displayed along the upper and right axes.

