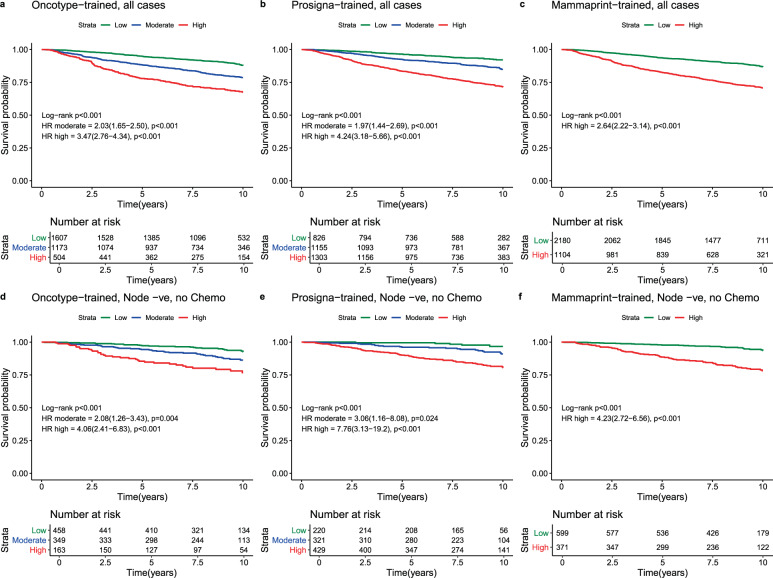
Fig. 1. Test performance in ER+ve, HER2-ve breast cancer from the TEAM cohort.
Kaplan–Meier survival curves with Log-rank Hazard ratios for cases of ER+ve, HER2−ve breast cancer from the entire TEAM cohort for Oncotype-trained (Panel a), Prosigna-trained (Panel b), and Mammaprint-trained results (Panel c) and for ER+ve, HER2−ve Node negative breast cancers treated without chemotherapy from the TEAM cohort for Oncotype-trained (Panel d), Prosigna-trained (Panel e), and Mammaprint-trained results (Panel 5). Log-Rank P values for each test are in brackets. Within each panel low (green), moderate (blue) and high (red) risk survival curves are plotted with LogRank Hazard ratios for high risk and intermediate risk (Oncotype-trained and Prosigna-trained only) calculated against low risk cases in each sub-group. 95% Confidence intervals for LogRank Hazard ratios are in brackets. For each group the number at risk (Low, moderate, high) are presented under the X axis.

