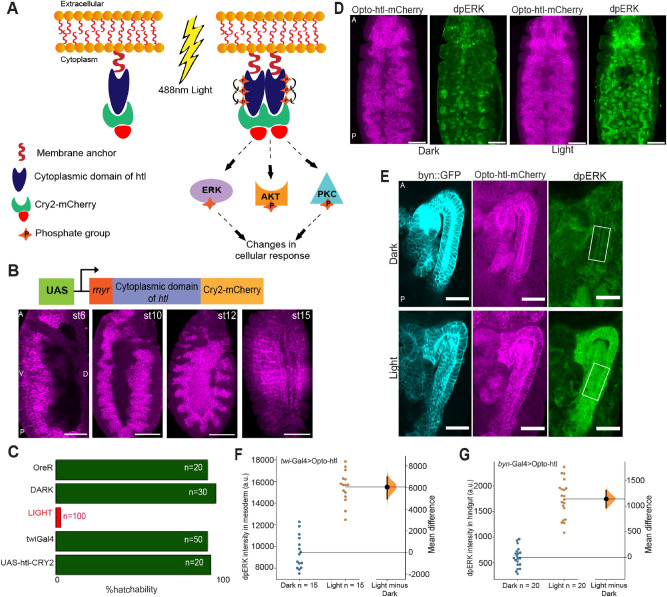
Figure 1.
Opto-htl expression and activation in different tissues. (A) Schematic showing design and activation of Opto-htl. Exposure to 488 nm light induces CRY2 clustering leading to activation of the (intracellular) membrane-bound receptor and eventually generating a cellular response via phosphorylation of various downstream target molecules. (B) twi::Gal4 > Opto-htl embryos stained with anti-mCherry antibody showing the expression of the construct at various stages. (C) Hatching rate assay for different genetic conditions. OreR = OregonR embryos under illumination, DARK = twi::Gal4 > Opto-htl embryos kept under illumination with amber paper to block 488 nm wavelengths throughout development, LIGHT = twi::Gal4 > Opto-htl embryos kept under illumination throughout development. twi::Gal4 embryos represent the Gal4 driver alone and UAS-htl-Cry2-mCherry represents Opto-htl embryos with no Gal4 driver kept under similar illumination conditions. (D) twi::Gal4 > Opto-htl embryos fixed and stained at late stage 10/early stage 11 for dpErk under dark and light conditions. (E) Byn::Gal4 > Opto-htl embryos fixed and stained at stage 16 for dpErk under dark and light conditions (scale bar 25 mm). (F) dpErk intensity differences in the mesoderm at late stage 10 between twi::Gal4 > Opto-htl embryos kept under dark versus light. (G) dpErk intensity differences in the hindgut between Byn::Gal4 > Opto-htl embryos under dark and light conditions in stage 16 measured in the region shown in (E). Scale bar = 50 μm unless stated otherwise. A = Anterior, P = Posterior, D = Dorsal, V = Ventral view. In (F,G), the black bar represents the 95% confidence interval with the Bootstrap distribution shown in orange and n represents number of embryos for each condition68.

